Desk Report
Yeastar Workplace desk report provides quantifiable data that shows how desks are being used across your entire workplace. This will help you optimize resources and utilization of desks using real-time data.
Requirement
Yeastar Workplace Plan: Standard Plan or Pro Plan
Access desk dashboard
-
Log in to Yeastar Workplace management portal.
-
Go to Desk > Desk Report.
The Yeastar Workplace desk dashboard displays as the following figure shows.
Click wizards in the image to learn more.
 |
|
 |
|
 |
 |
 |
 |
 |
|
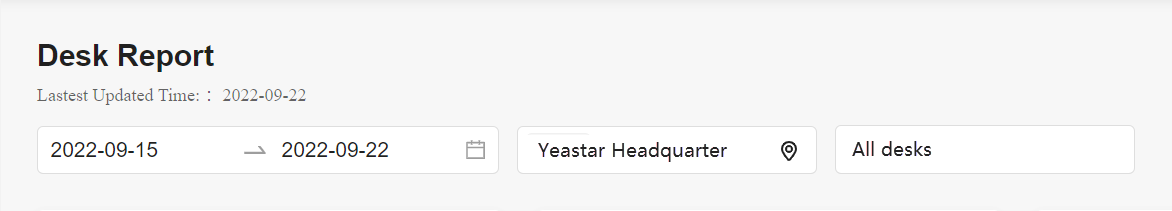
Dashboard header and filters
The header shows the latest update time and the supported filters.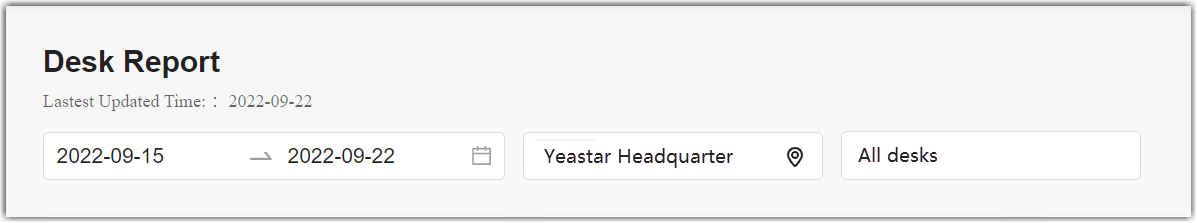
-
Time filter:
- By default, the dashboard displays the desk data for the last 7 days (including the current day).
- Support filtering desk data by time range, up to the last 90 days of historical data.
-
Location filter:
- By default, the dashboard displays the desk data for all the buildings and floors in the system.
- Support filtering desk data by specific buildings(s) or floor(s).
-
Desk filter:
- By default, the dashboard displays the data for all the desks in the selected location.
- Support filtering desk data by the desk names.
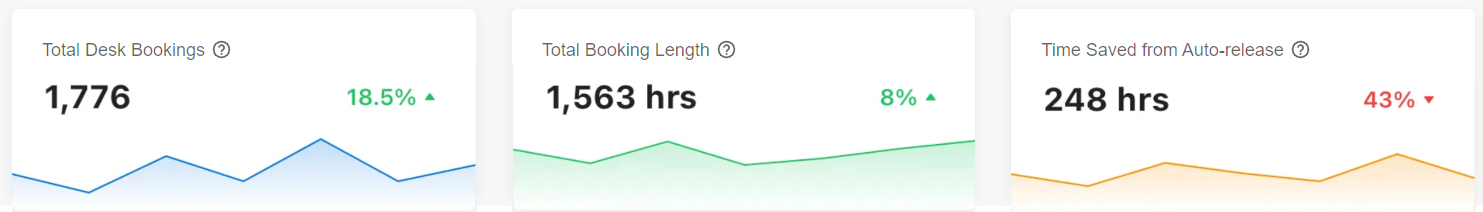
Desk basic information

These three wizards show the overall data of desk usage in the selected time range, including the total number, percentage change, and trends.
This offers you a full overview of desk utilization.
- Total Desk Bookings: Show data of all the flexible desk reservations made within your company over the selected time range.
- Total Booking Length: Show the hours of flexible desk reservations.
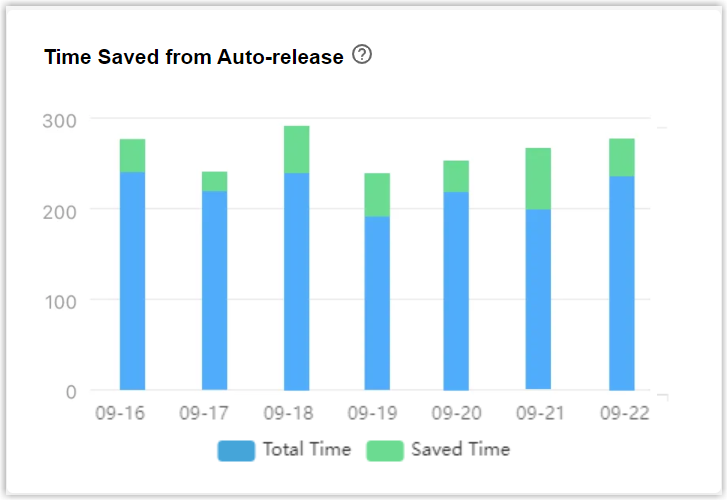
- Time Saved from Auto-release: When the auto-release strategy is enabled, the system will automatically release desks when no check-in occurs or no one was detected on the desk. This chart shows the total time saved from auto-release strategy.
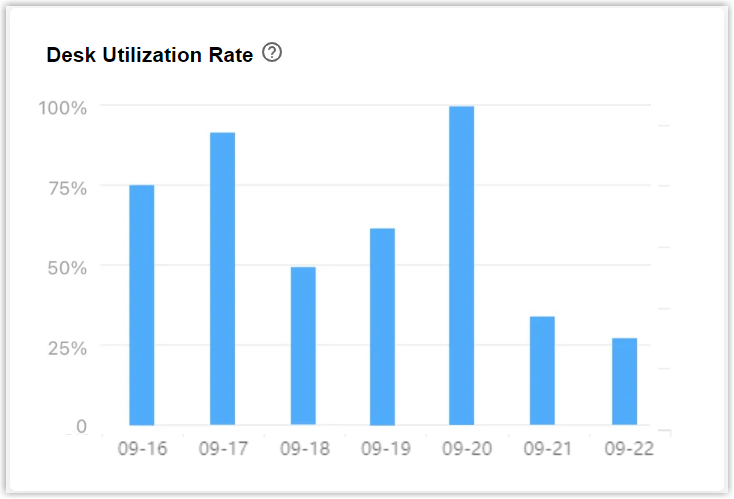
Desk utilization rate
This chart shows the utilization rate of flexible desks in your company. Hover over a bar to view the precise data.
The utilization rate is calculated by dividing the total number of hours booked by the total bookable time.
Why is it helpful?
Desk utilization rate is the most direct indication of how desks are being used. It helps you determine whether the current flexible desks are sufficient and whether they need to be expanded or reduced.
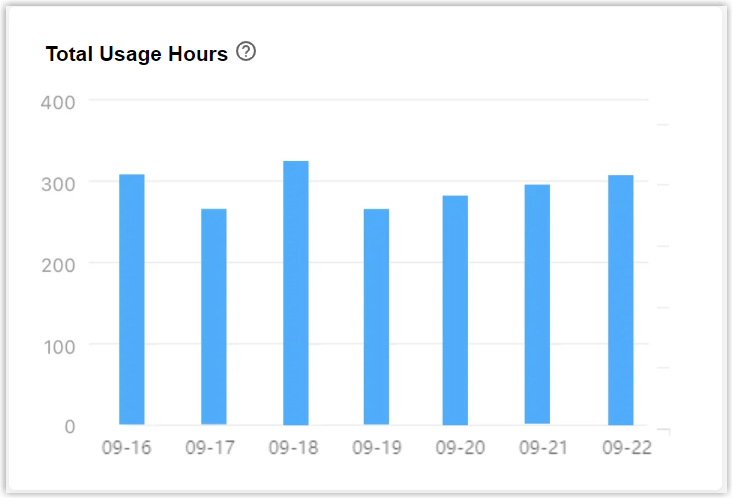
Total usage hours
This chart shows the total time for flexible desk reservations on each day over the selected time range. Hover over a bar to view the precise data.
Why is it helpful?
Total Usage Hours helps you identify typical desk usage patterns in your workplace.
View the weekly and monthly data to see if there are seasonal peaks, and add some additional flexible desks during the scheduling peaks.
Time saved from Auto-release
This chart shows the time saved from the auto-release strategy compared with the total time of normal flexible desk reservations. Hover over a bar to view the precise data.
Auto-release strategy varies depending on whether there are sensors connected to your system.
- No sensors connected: Release desks when no check-in occurs over a customizable duration.
- Sensors connected: Release desks when no check-in occurs over a customizable duration, or nobody is detected on a desk by people counting sensors over a customizable duration.
Why is it helpful?
This wizard helps you understand the proportion of time saved from the release strategy of flexible desks and improve desk utilization.
When the ratio of auto-release time is higher than you expected, it may indicate that employees in your workplace are not familiar with the desk usage flow, remind them to check in to their desk bookings in time or cancel desk reservations when they can not show up.
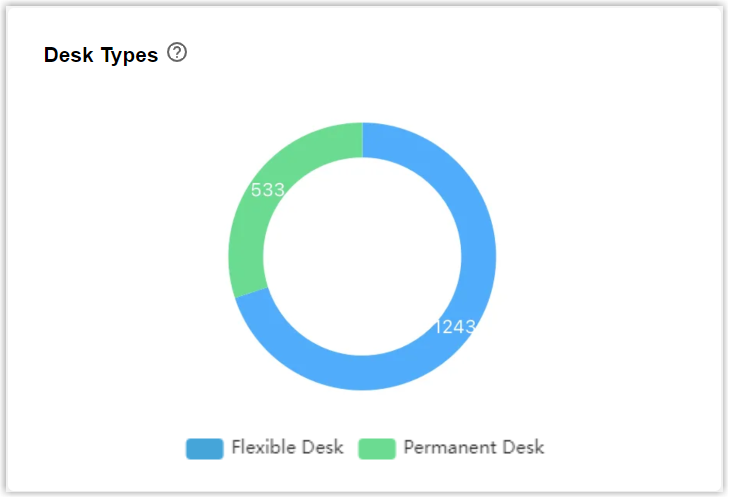
Desk Types
This chart shows the number and comparison of flexible desks and permanent desks in your workplace.
Why is it helpful?
Desk types give you an overview of the desk resources in your workplace.
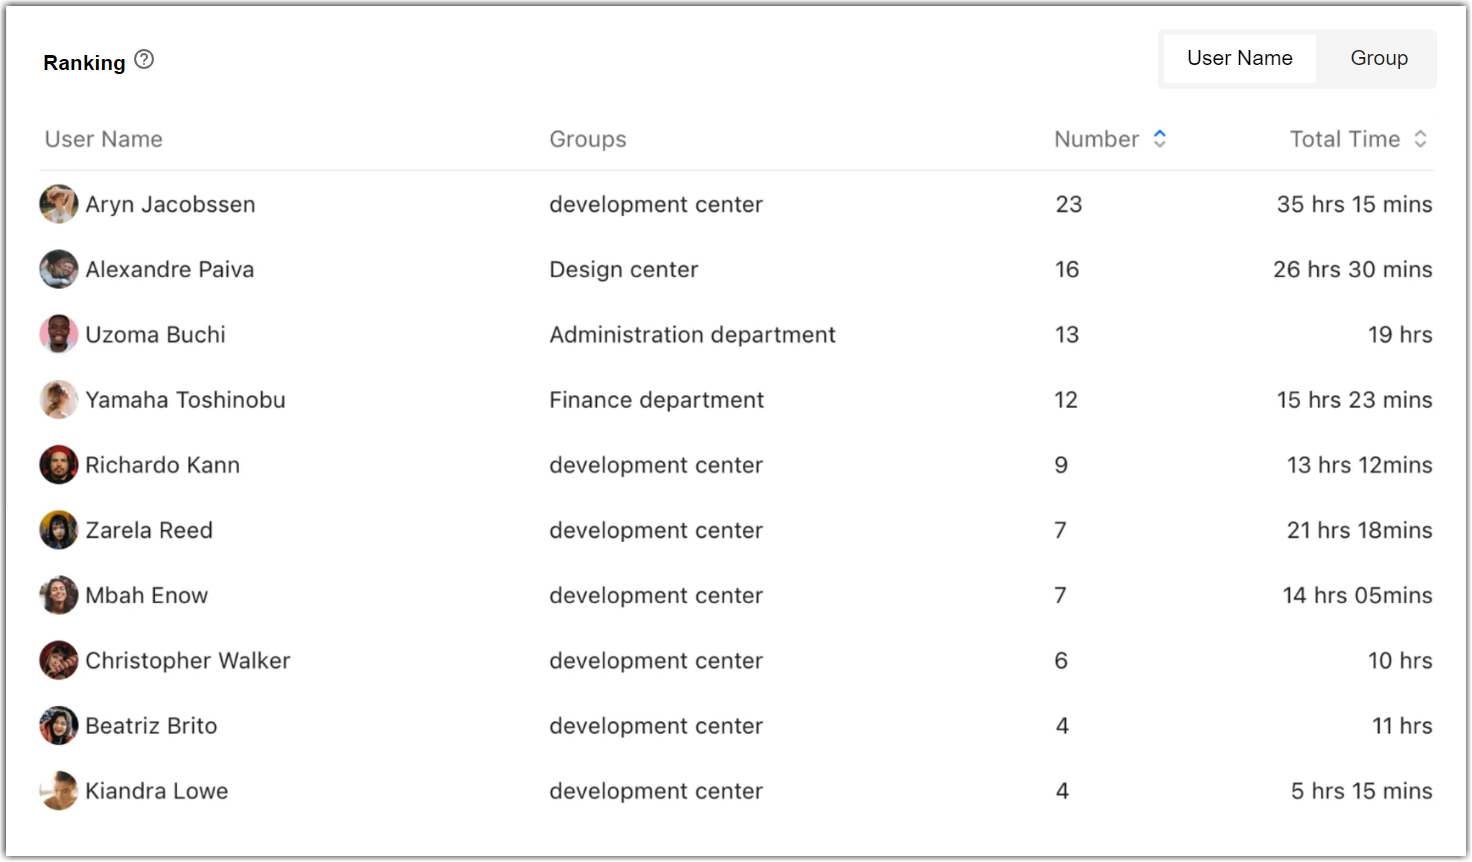
Ranking
This chart shows the rankings of the employees and groups in your company in terms of total desk reservations and duration.
Click User Name or User Group on the top right corner to switch reports.
Why is it helpful?
Ranking helps you get to know the most frequent users or groups in booking flexible desks.
-
The most frequent users
View this data monthly, if a user books desks for over 100 hours, it means he/she spends more than 60% time of working hours at a desk on average (assuming an 8-hour workday, 21 workdays a month). You can consider assigning a permanent desk to this user to save him/her the trouble of booking flexible desks frequently.
-
The most frequent groups
For better teamwork and communication, you can specify an area and restrict the booking permissions of desks in it to the most frequent groups. Then notify the group members. So when users from the same group schedule desks, they are able to book desks near each other.
Created: September 30, 2022