Meeting Room Report
Yeastar Workplace Dashboard offers quantifiable data that shows how facilities, equipment, and employees are engaging in meeting rooms.
With the reporting and analytics that Yeastar Workplace dashboard provides, you can get a full overview of how meeting rooms are being used across your entire workplace. This will help you optimize resources and utilization of meeting rooms using real-time data.
Requirement
Yeastar Workplace Plan: Standard Plan or Pro Plan
Access and use meeting room report
Access meeting room report
- Log in to Yeastar Workplace management portal.
- Go to Meeting Room > Room Report.
The Yeastar Workplace room report displays as the following figure shows.
Click wizards in the image to learn more.
 |
|
 |
|
 |
 |
 |
 |
 | |
Dashboard header
The header shows the latest updated time and supported filters.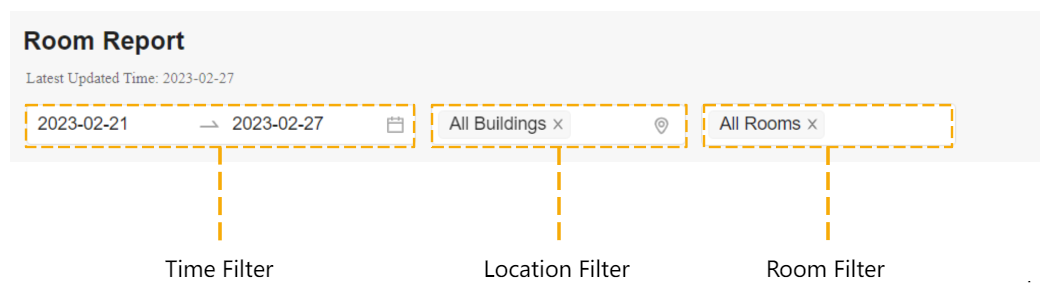
Time Filter:
Filter by time range you're interested in. You can filter up to 90 days of historical data.
By default, the dashboard displays the meeting room data for the last 7 days (including the current day).
Location Filter:
Filter meeting rooms by specific buildings or floors.
By default, the dashboard displays the meeting room data for all the buildings and floors in the system.
Room Filter:
Filter specific meeting rooms by name.
By default, the dashboard displays the data of all the meeting rooms in the system.
Meeting room information
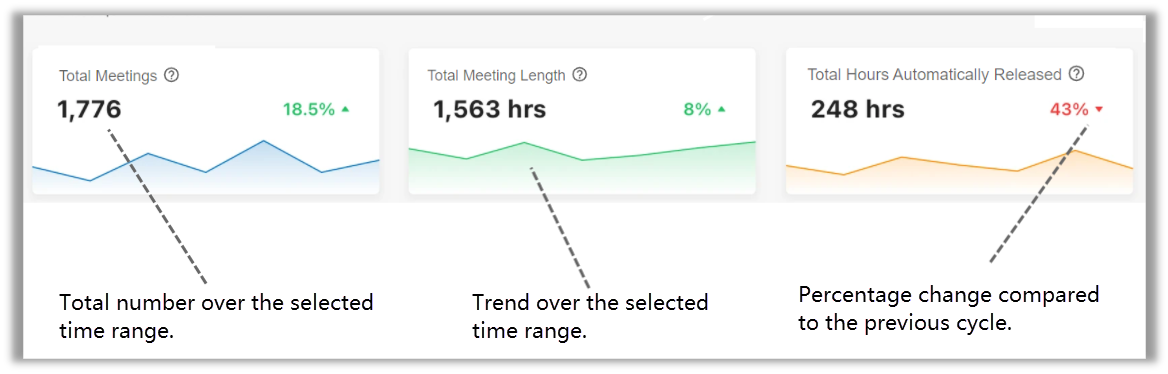
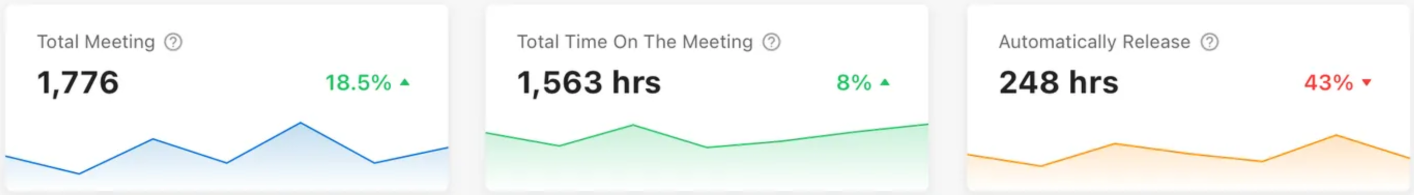
These three wizards show the overall data of meeting room usage over a period of time, including the statistics, trends, and percentage change.
This offers you a full overview of how meeting rooms are being used.
- Total Meetings: Count the total number of ended meetings held by all employees in a period of time.
- Total Meeting Length: The total length of the meetings that have ended.
- Total Hours Automatically Release: When no check-in occurs or nobody is detected in a room, the room will be automatically released. This counts the total length of time saved due to the auto-release.
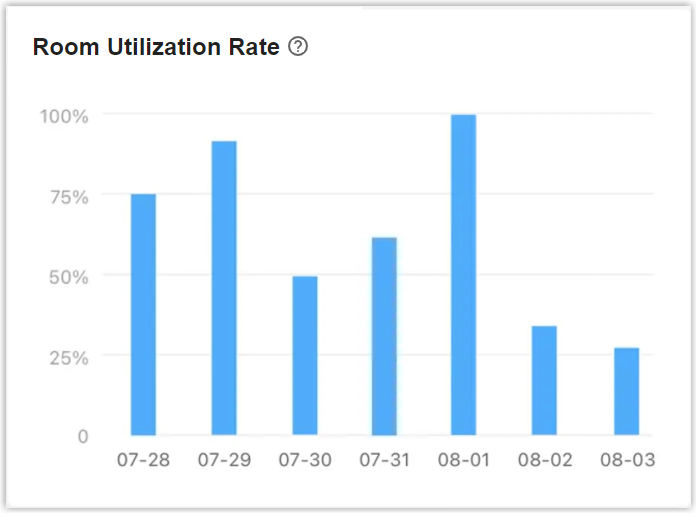
Room utilization rate
This chart shows the percentage of time that meeting rooms were actually used during the selected date range. Roll over each block to see the exact percentage of a day.
Utilization rate is calculated by dividing the total number of hours used by the total bookable time.
Why is it helpful?
Room utilization rate is the most direct indication of how meeting rooms are being used. It helps you determine whether the current meeting room space is sufficient and whether it needs to be expanded or reduced.
- When the utilization rate is over 60%, people in your workplace are likely to have trouble finding available rooms at times they expect.
- When the utilization rate is under 40%, meeting rooms in your workplace may be excessive. You could repurpose some rooms for higher-demand activities.
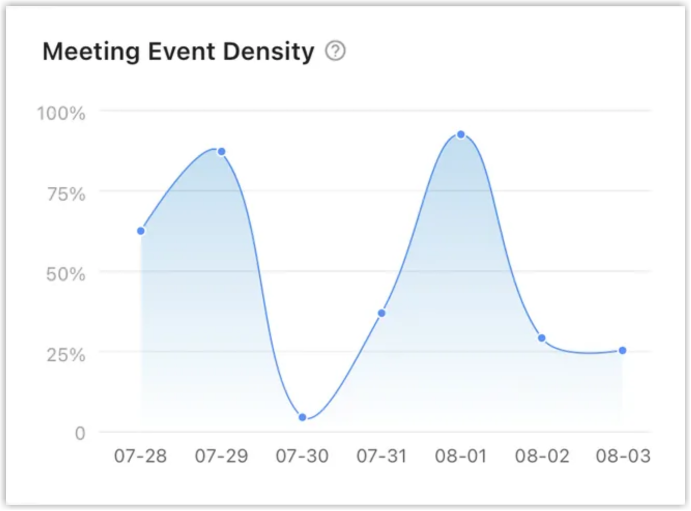
Meeting event density
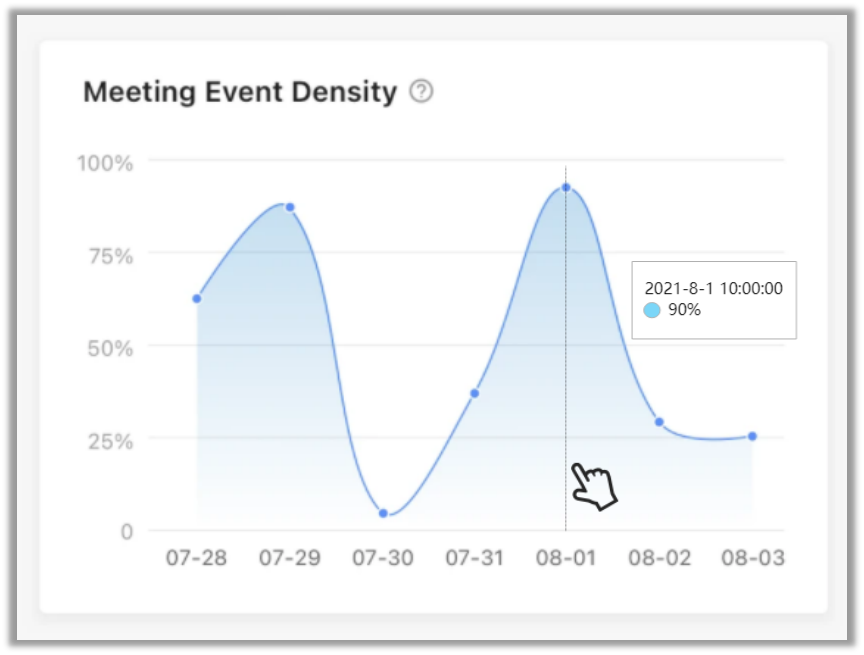
This graph shows the percentage of meeting rooms hosting meetings at a given time.
Meeting density reflects typical utilization patterns for meeting rooms, revealing the busiest and idle periods, which helps admins discover scheduling bottlenecks and optimize room utilization.
Roll over each block to see which hour(s) of the day have the greatest number of booked rooms.
Why is it helpful?
Meeting event density helps you to understand whether your office is truly cramped for meeting rooms and avoid conflicts in booking meeting rooms.
Go to Meeting Room > Room Schedule, have a look at the upcoming meetings, and locate particularly busy times. Evaluate whether these meetings must be held at that time. Move certain meetings with flexibility, such as team status meetings to a different time of day.
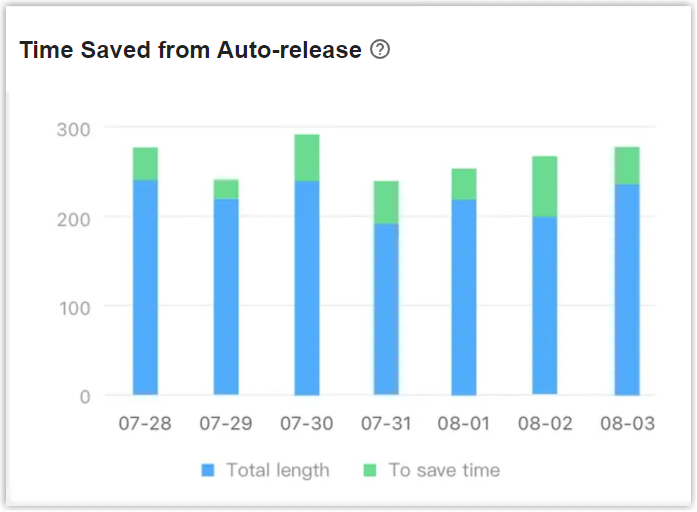
Time saved from auto-release
This chart shows the time saved from the auto-release strategy of the meeting rooms compared with the time of normal meetings.
Auto-release strategy varies depending on whether there are sensors connected to your system.
- No sensors connected: Release rooms when no check-in occurs over a customizable duration.
- Sensors connected: Release rooms when no check-in occurs over a customizable duration, and nobody is detected in a room by people counting sensors over a customizable duration.
Roll over each block to see the saved time of a day.
Why is it helpful?
This wizard helps you understand the proportion of time saved from the release strategy of the meeting room and improve room utilization.
It happens when rooms were booked but no one showed up, or when folks cancel or reschedule an event without updating the room reservation. Yeastar Workplace releases these unused rooms automatically for others to use.
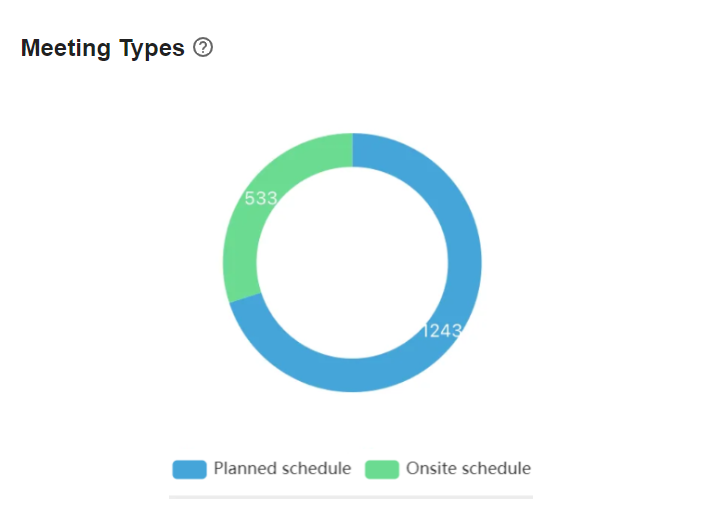
Meeting types

This graph displays a comparison between the planned schedule and onsite schedule.
- Planned schedule: The number of meetings booked through Yeastar Workplace web portal and third-parties.
- Onsite schedule: The number of meetings booked on Room Displays.
Why is it helpful?
Meeting types help you understand which type prevails and the percentage.
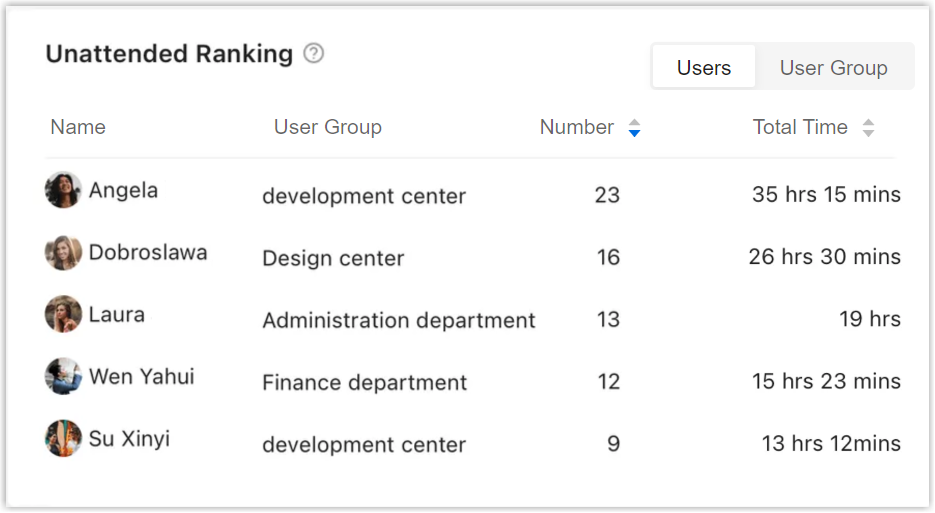
Unattended ranking
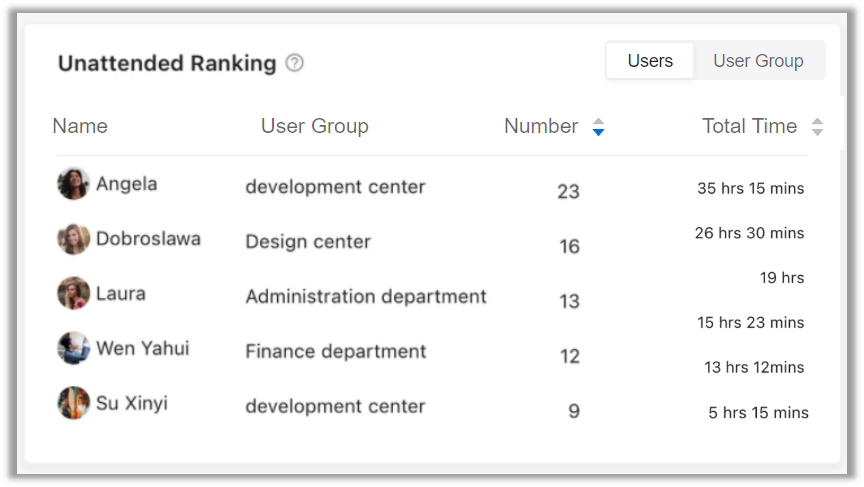
This chart shows the rankings of the users and groups in your company in terms of the total number and time of unattended meetings
Click Users or User Group on the top right corner to switch reports.
Why is it helpful?
Unattended ranking helps you find out who often forgets to check in or check out when it ends earlier. Remind them to check in and check out in time to improve the utilization of meeting rooms.
Created: December 16, 2021
Author: Cody