Yeastar Workplace Dashboard
Yeastar Workplace dashboard provides quantifiable real-time data to help you get a full overview of your workspace, including the real-time usage of meeting rooms and desks, the total number and trend of visits, and the real-time status of devices added to your system.
Access Yeastar Workplace dashboard
- Log in to Yeastar Workplace management portal.
- Go to Dashboard.
The Yeastar Workplace dashboard displays as the following figure shows.
Click wizards in the image to learn more.
 |
|
 |
 |
 |
 |
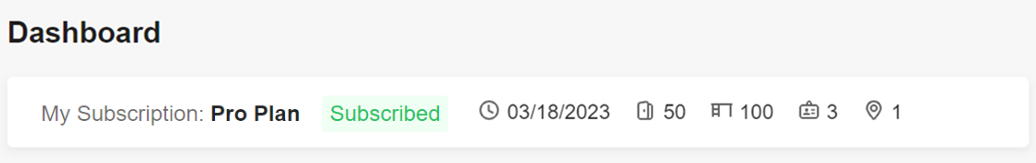
Plan and Services
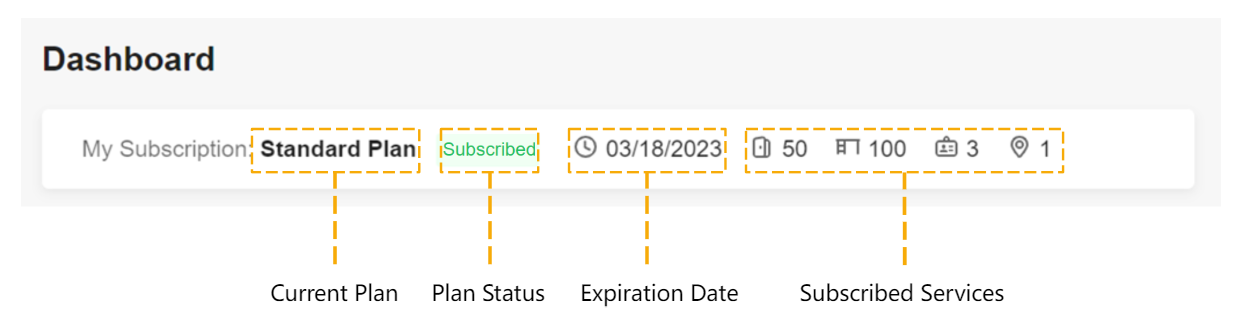
This section shows your plan information and the subscribed services:
![]() (Meeting room)
(Meeting room)
The maximum number of meeting rooms you can add in Yeastar Workplace.
![]() (Desk)
(Desk)
The maximum number of desks you can add in Yeastar Workplace.
![]() (Visitor Screen)
(Visitor Screen)
The maximum number of Visitor Screens that you can add to Yeastar Workplace.
![]() (Location)
(Location)
The maximum number of buildings you can add in Yeastar Workplace.
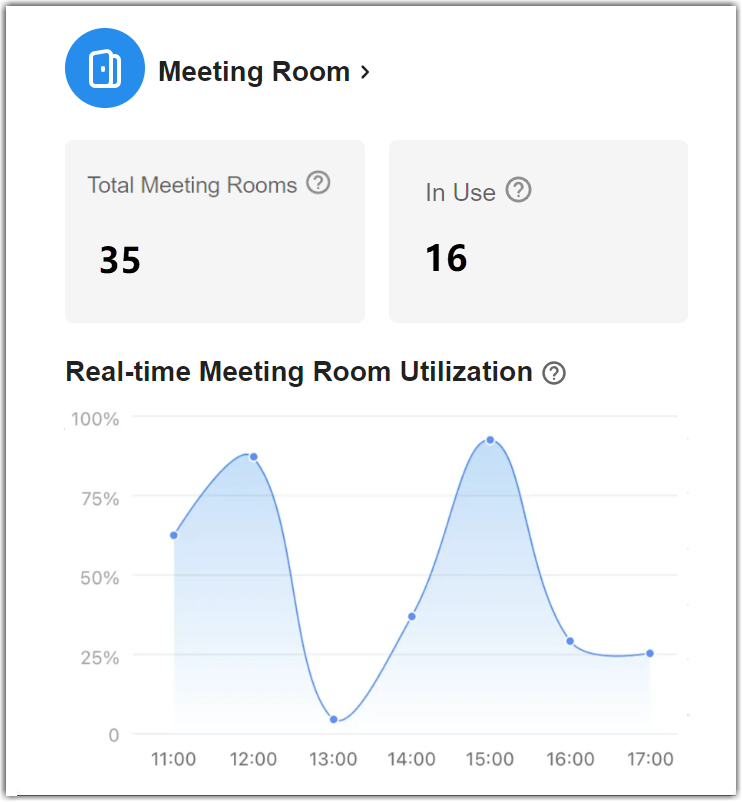
Meeting Room
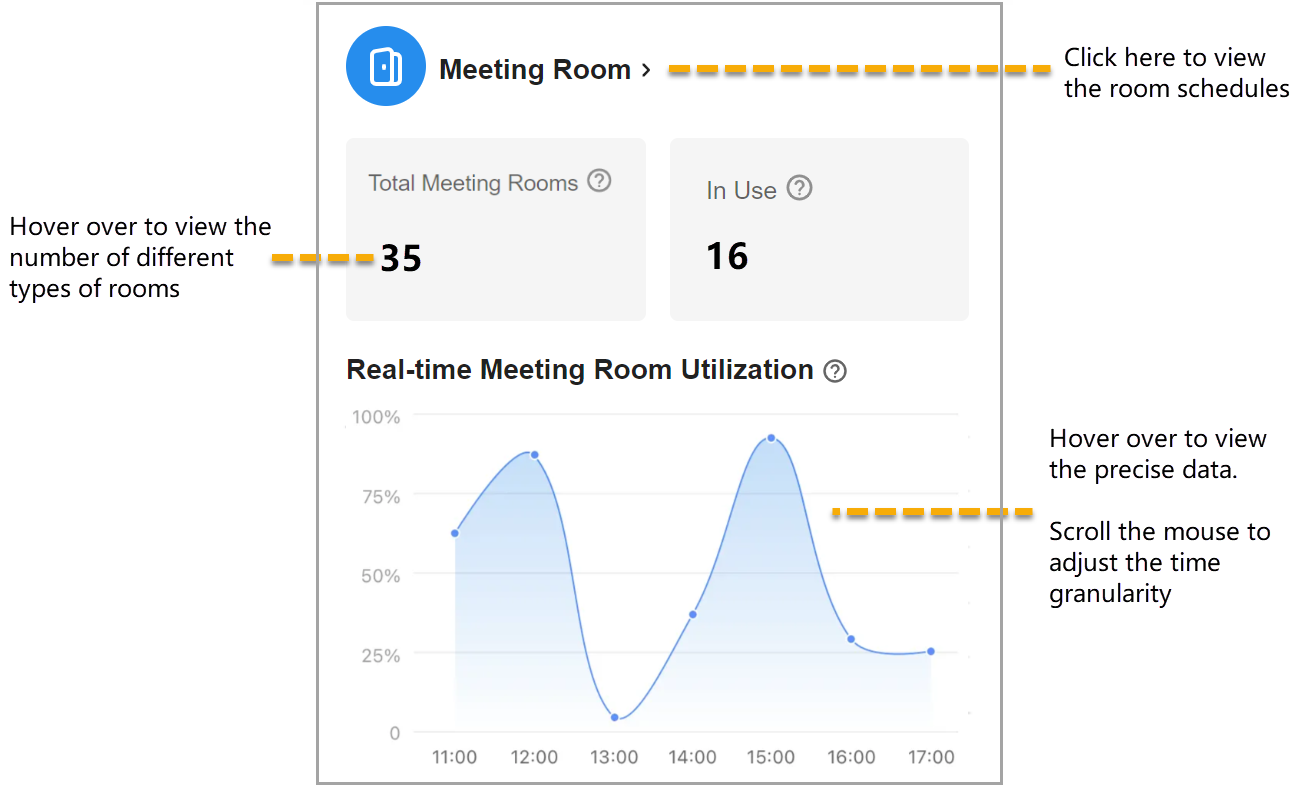
This chart shows the total number and the real-time usage of meeting rooms in your company.
- Meeting Room >: Click to view the meeting room schedules.
- Total Meeting Rooms: This figure shows how many meeting rooms you have added to the system, hover over the number to view the number of dedicated rooms and disabled rooms in it.
- In Use: This figure shows the total number of meeting rooms currently in use within your company.
- Real-time Meeting Room Utilization: This graph reflects the real-time meeting room utilization in your company. Hover over to view the precise data or scroll the mouse to adjust the time granularity.
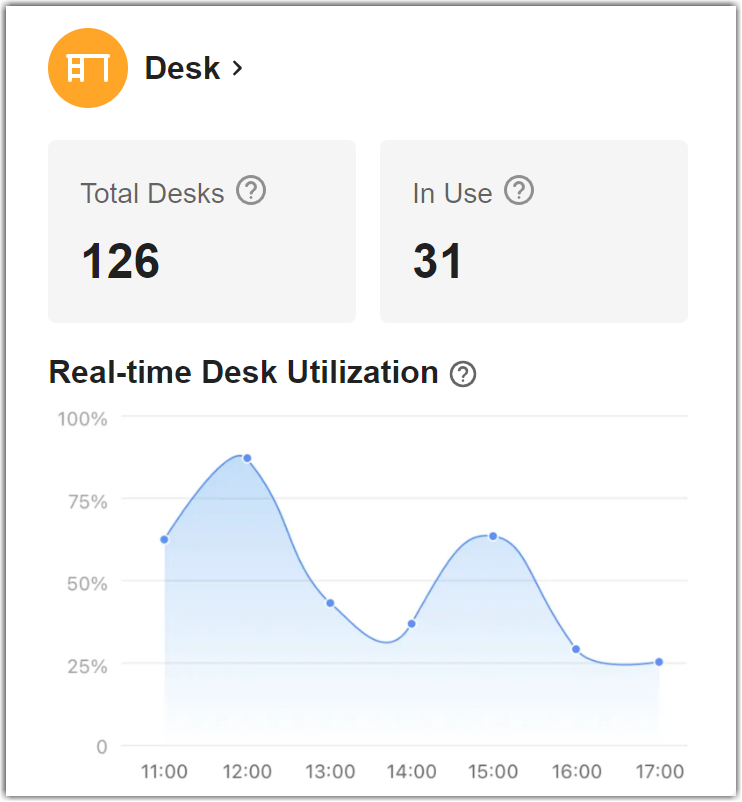
Desk
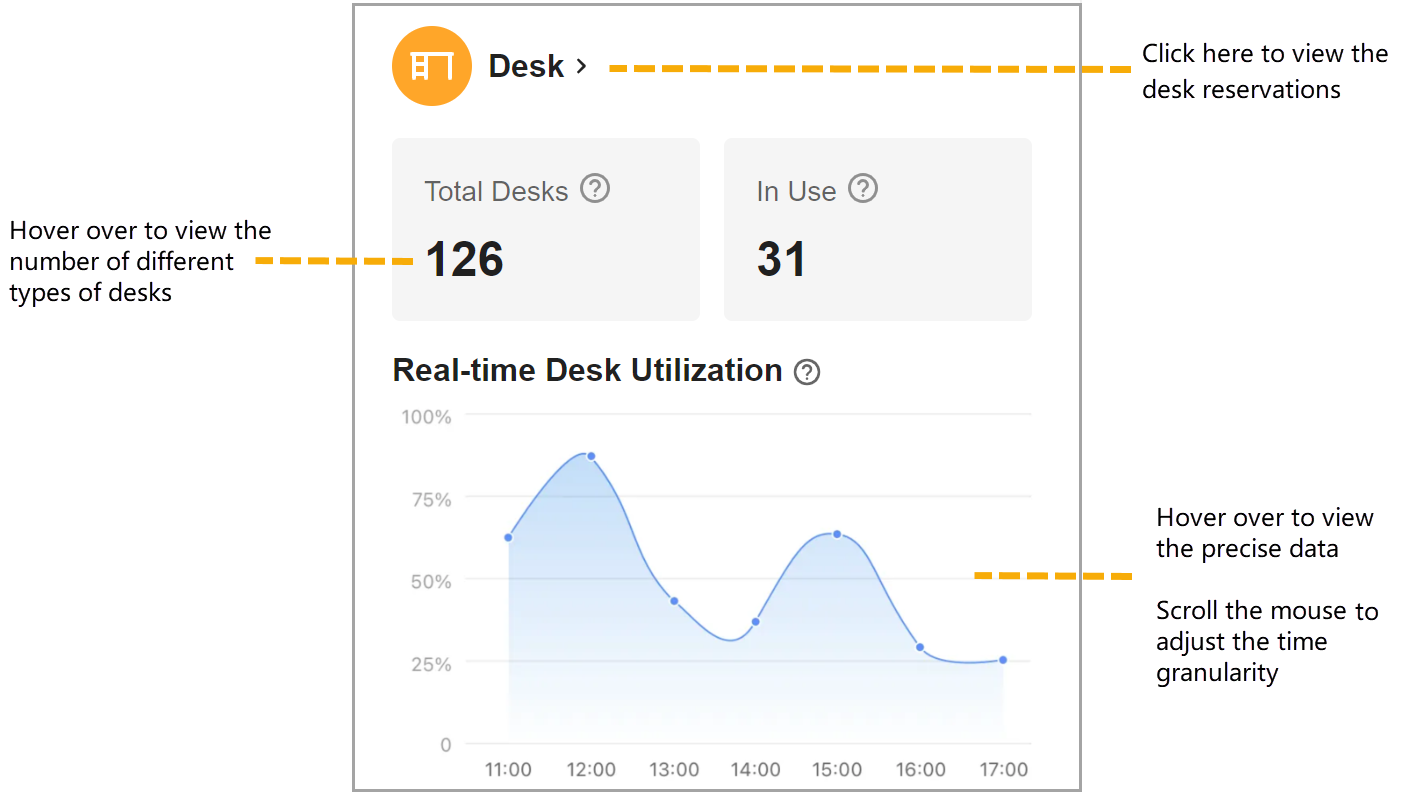
This chart shows the total number and the real-time usage of desks in your company.
- Desk >: Click to view the desk reservations.
- Total Desks: This figure shows how many desks you have added to the system, hover over the number to view the number of dedicated desks and permanent desks in it.
- In Use: This figure shows the total number of desks currently in use within your company.
- Real-time Desk Utilization: This graph reflects the real-time meeting desk utilization in your company. Hover over to view the precise data or scroll the mouse to adjust the time granularity.
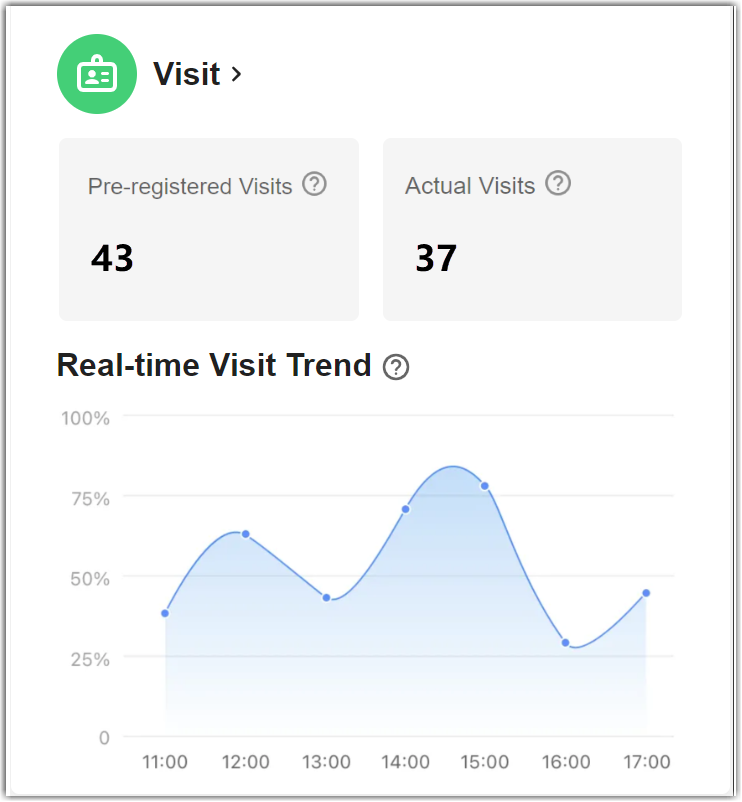
Visit
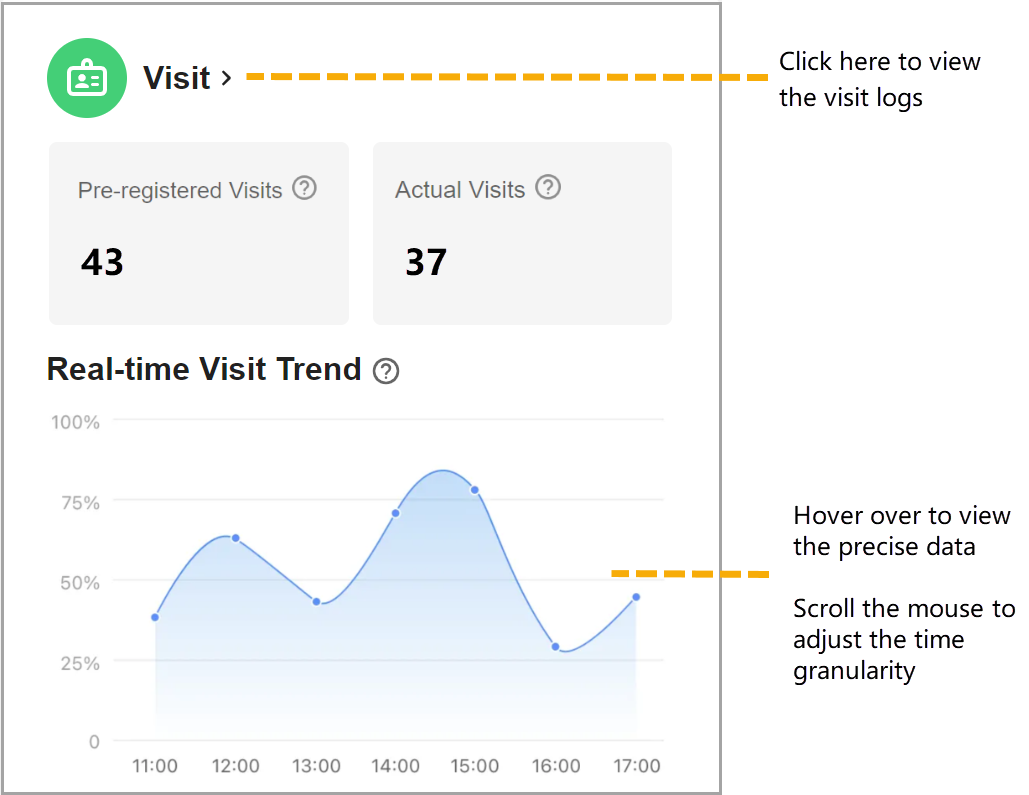
This chart shows the total number of visits and real-time visit trends within the enterprise for the current day.
- Visit >: Click to view the visit logs.
- Pre-registered Visits: This figure shows the total number of visit schedules created for the current day by employees in your company.
- Actual Visits: This figure shows the total number of checked-in visits, including those created by employees and those created by visitors on-site.
- Real-time Visit Trend: This graph reflects the real-time visit trend in your company. Hover over to view the precise data or scroll the mouse to adjust the time granularity.
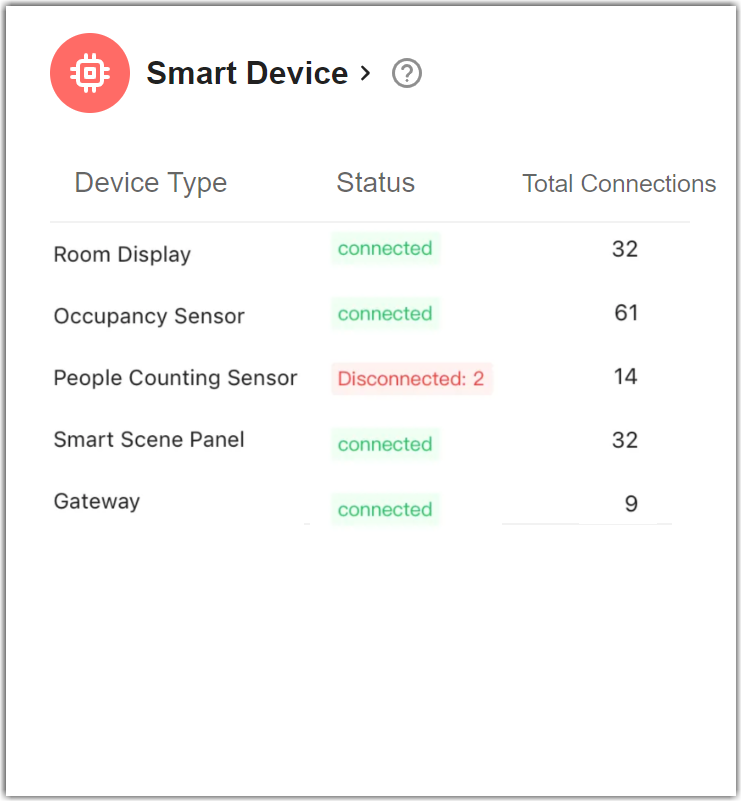
Smart Devices
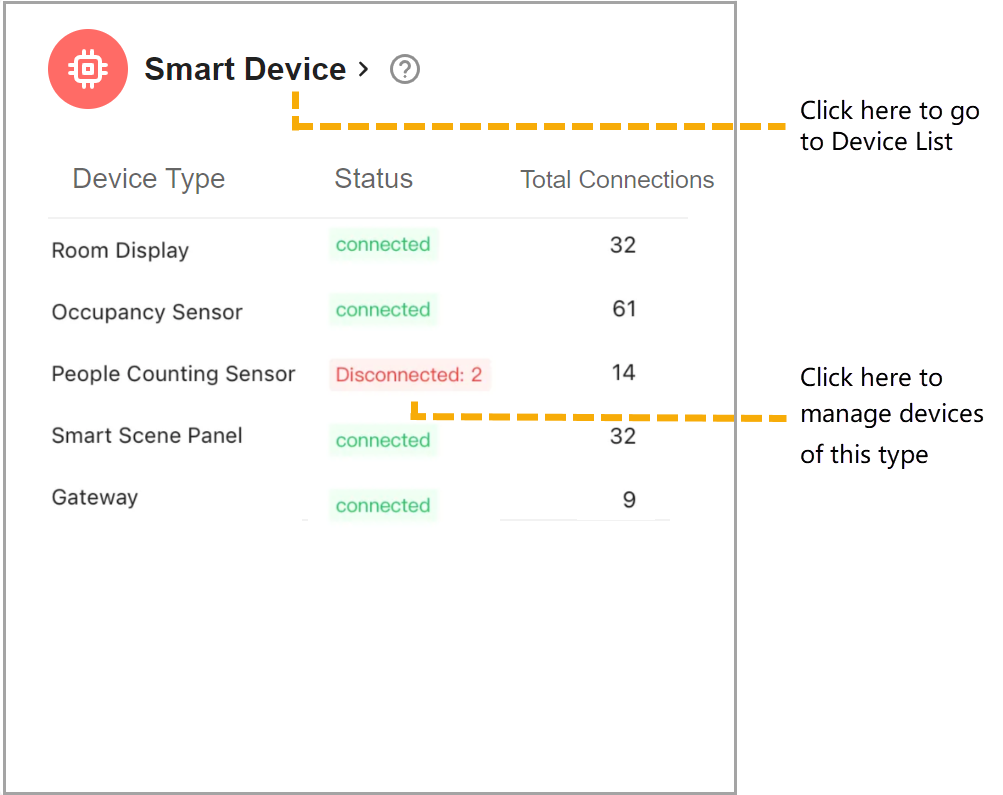
This chart shows the status and the number of all devices added to the system.
Click Smart Devices > to go to the device list for management.
Click the status beside a device type to manage devices of this type.
Created: October 18, 2022