Dashboard Overview
Yeastar P-Series Cloud Edition Dashboard gives you a historical and real-time view of what is happening on the PBX. This topic describes all the widgets on the Dashboard.
Introduction
- Dashboard: The dashboard offers multiple widgets that
display real-time system performance metrics and resource utilization, and
allows you to quickly access specific PBX features by simple click on
headings.The supported widgets are listed below:
- System performance
- System information
- Plan
- Add-On
- Capacity
- System status
- Event trend
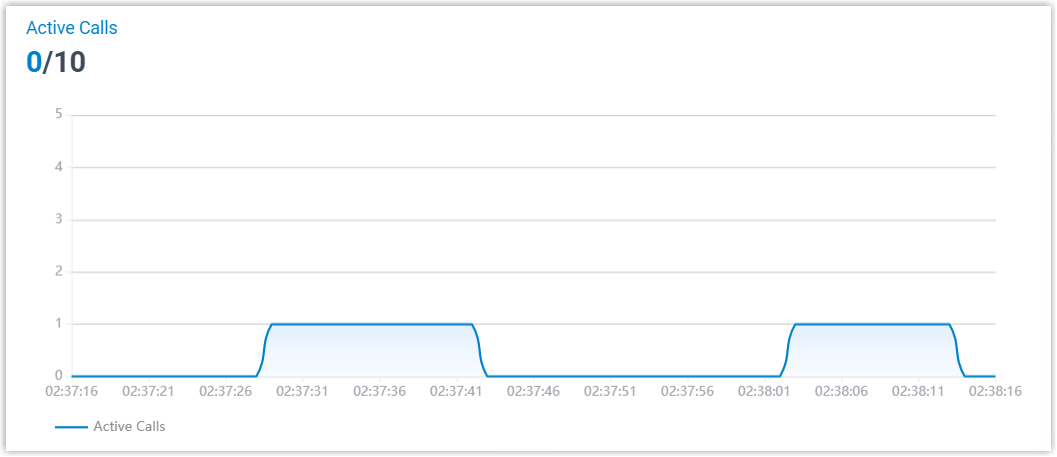
- Active Call: This panel provides real-time monitoring on active calls and extension status. For more information, see Active Call Panel Overview.
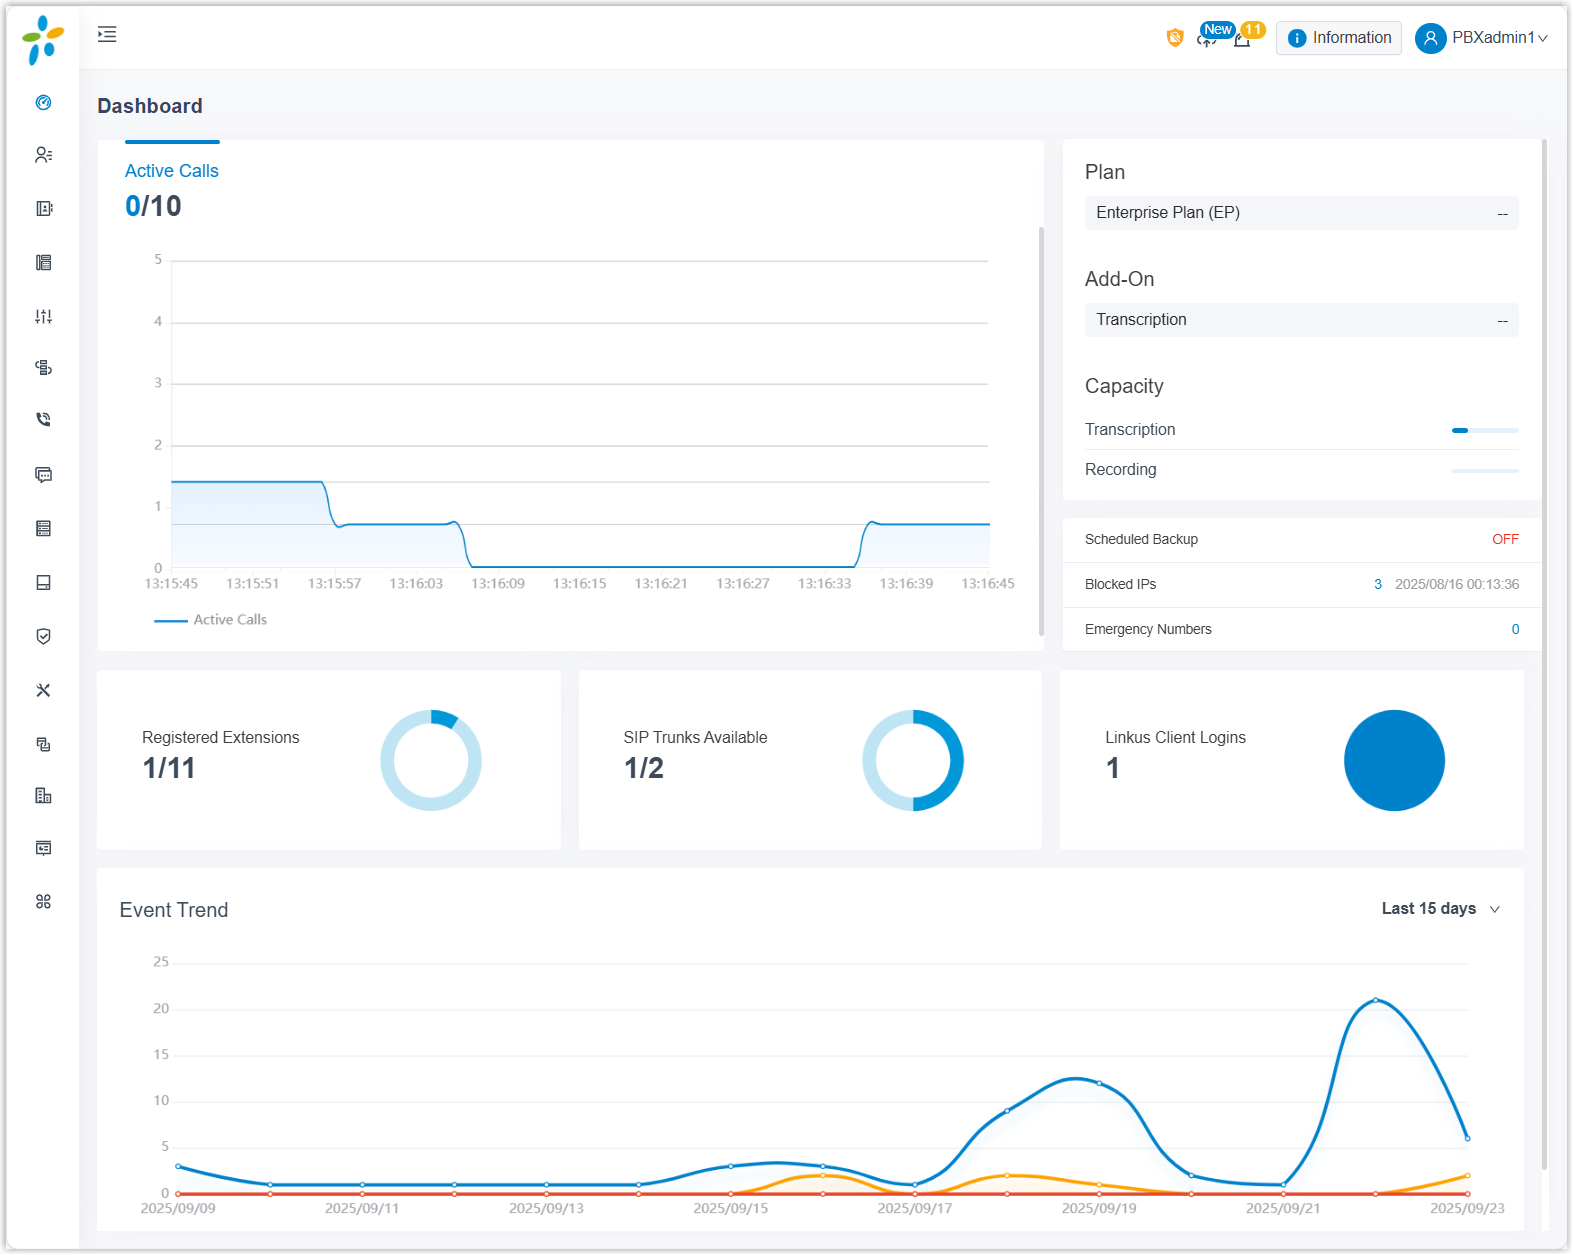
Dashboard layout
The following figure shows the layout of the Dashboard. Click any area of interest to view the detailed description of the corresponding widget.
System performance
- Active Calls: The real-time and the supported concurrent calls.
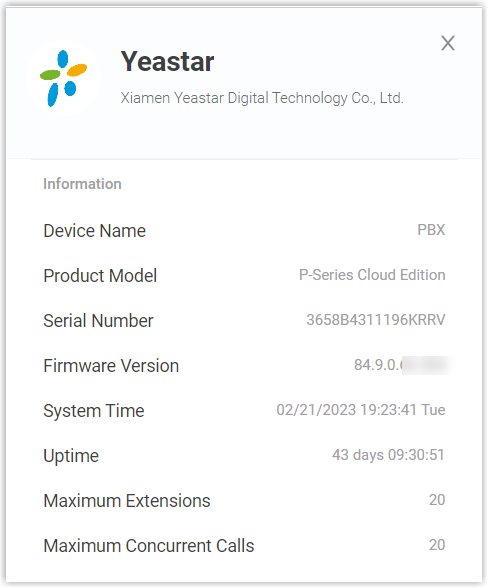
System information
Click Information at the top-right corner. System information displays the PBX's basic information.
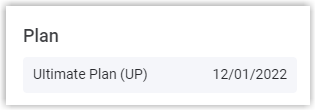
Plan
Plan displays the plan that you subscribe to or try and its expiration date.
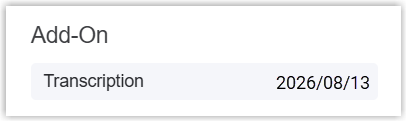
Add-On
Add-On displays the additional service that you subscribe to and its expiration date.
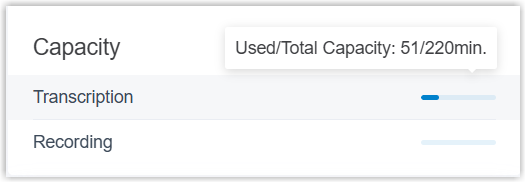
Capacity
Capacity displays the used and total minutes for AI transcription (powered by the PBX's built-in AI engine), AI receptionist, and recording.
System status
System status displays the following information:
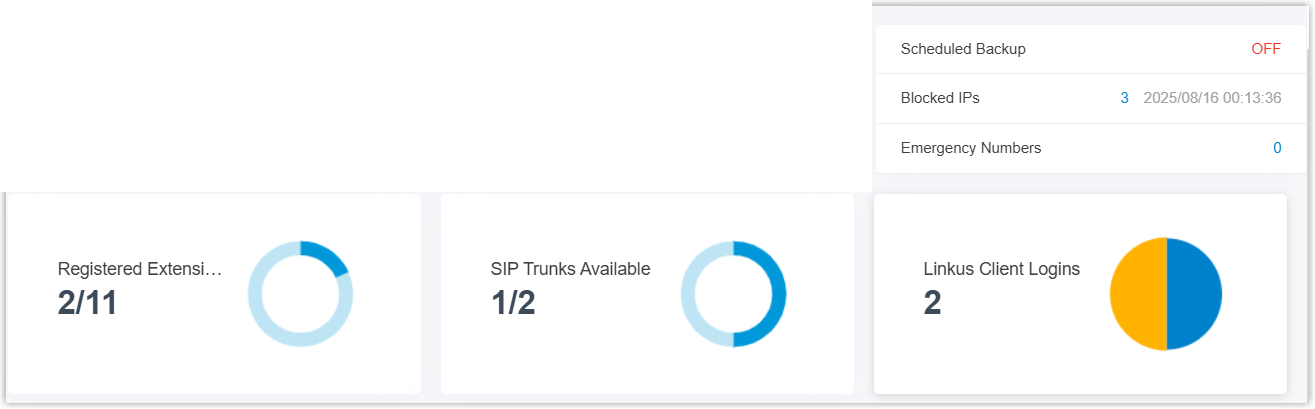
- Registered Extensions: The number of registered extensions and created extensions.
- SIP Trunks Available: The number of available trunks and created trunks.
- Linkus Client Logins: The number of Linkus clients where users has logged.
- Scheduled Backup: Whether scheduled backup feature is enabled or not. If enabled, the system displays the last time when a backup file was created.
- Blocked IPs: Display the following information:
- The number of IP address and account that were blocked by the PBX.
- The last time when an IP address or an account was blocked by the PBX.
- Emergency Numbers: The number of created emergency numbers.
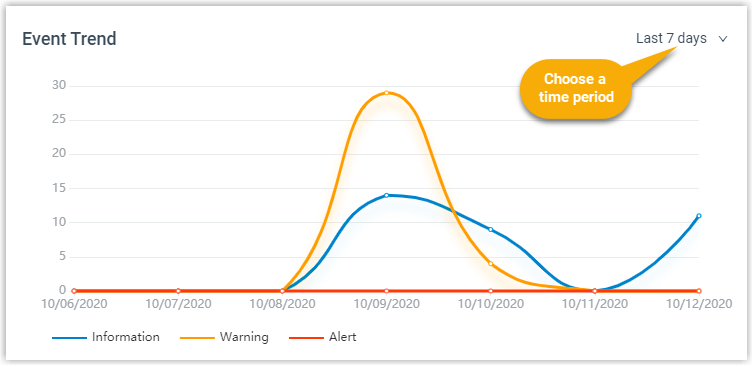
Event trend
Event trend provides historical and real-time view of system events. You can track frequency of events that were triggered during the last 7 days, 15 days, or 30 days.