Check System Resources of Connected P-Series PBX System
Yeastar Central Management allows you to monitor the system resources of a remotely connected P-Series PBX system (Appliance Edition or Software Edition) through a monitoring window. This helps you track and analyze the PBX system performance and promptly detect and resolve issues.
Requirements
- Subscribe to Remote Management Premium service.
- The firmware of the P-Series PBX system should meet the following
requirements:
- P-Series Appliance Edition: Version 37.15.0.91 or later
- P-Series Software Edition: Version 83.15.0.91 or later
Prerequisites
You have connected the P-Series Appliance/Software Edition to Yeastar Central Management.
For more information, see Connect PBX System/Gateway to Yeastar Central Management Using Yeastar ID and Connect PBX System/Gateway to Yeastar Central Management Using Authentication Code.
Procedure
- Log in to Yeastar Central Management, go to .
- On the right of the desired device, click
 .
.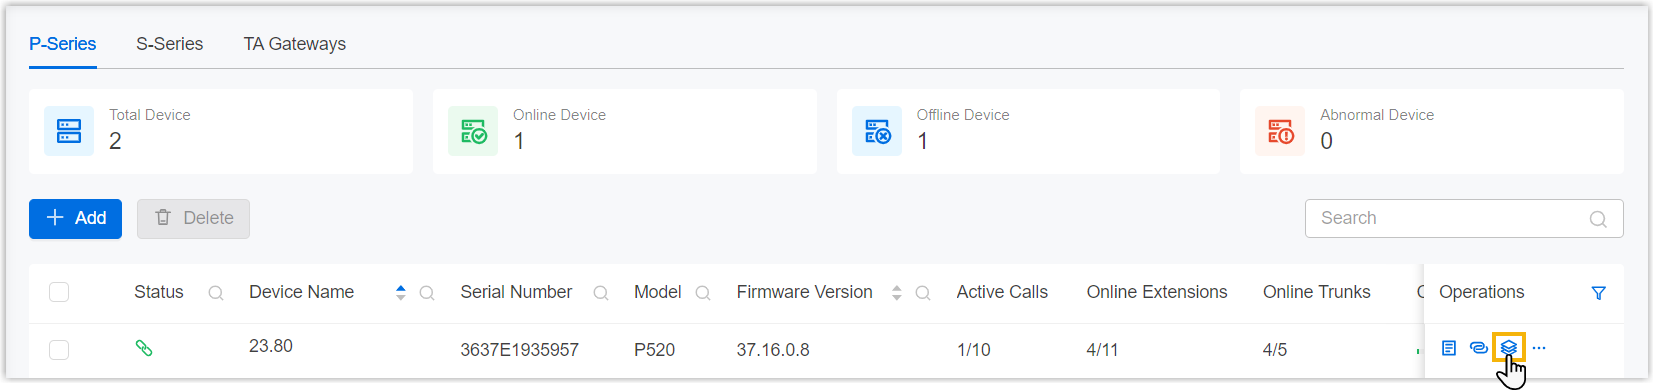
A resource monitoring window of the device pops up.
- Check the metrics and trends in the pop-up window according to your need.
Check current resource utilization
In the field, check the current utilization of active calls (concurrent calls), extensions, and trunks on the PBX system in the last 1 hour, 3 hours, 6 hours, 12 hours, or 24 hours.
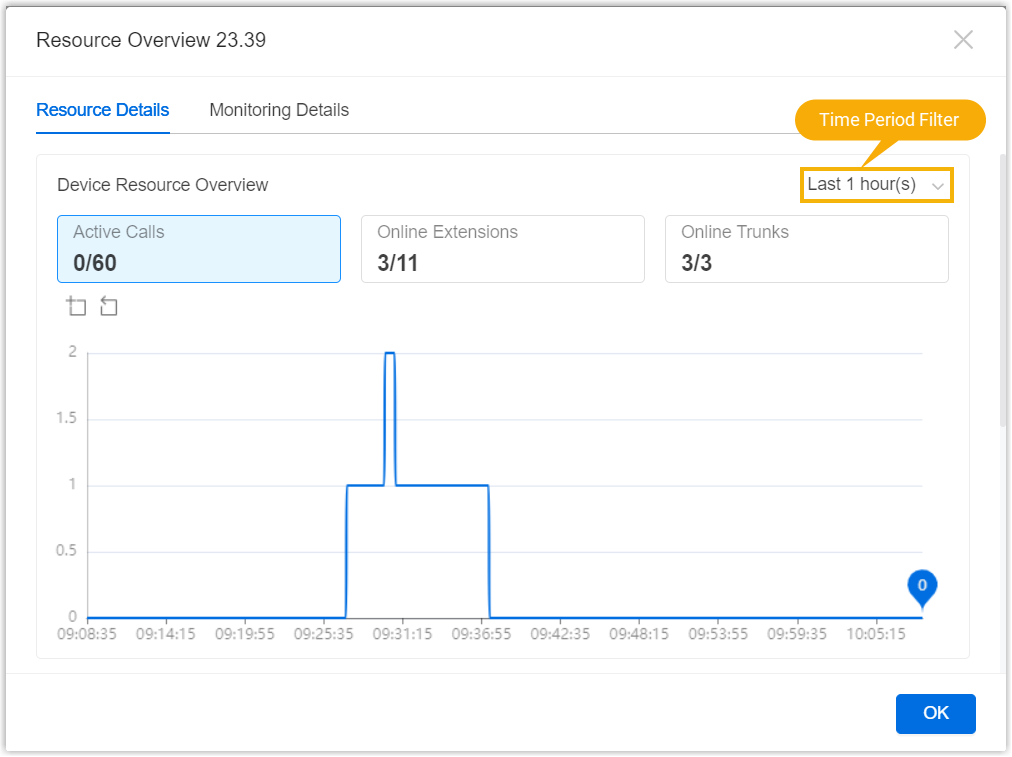
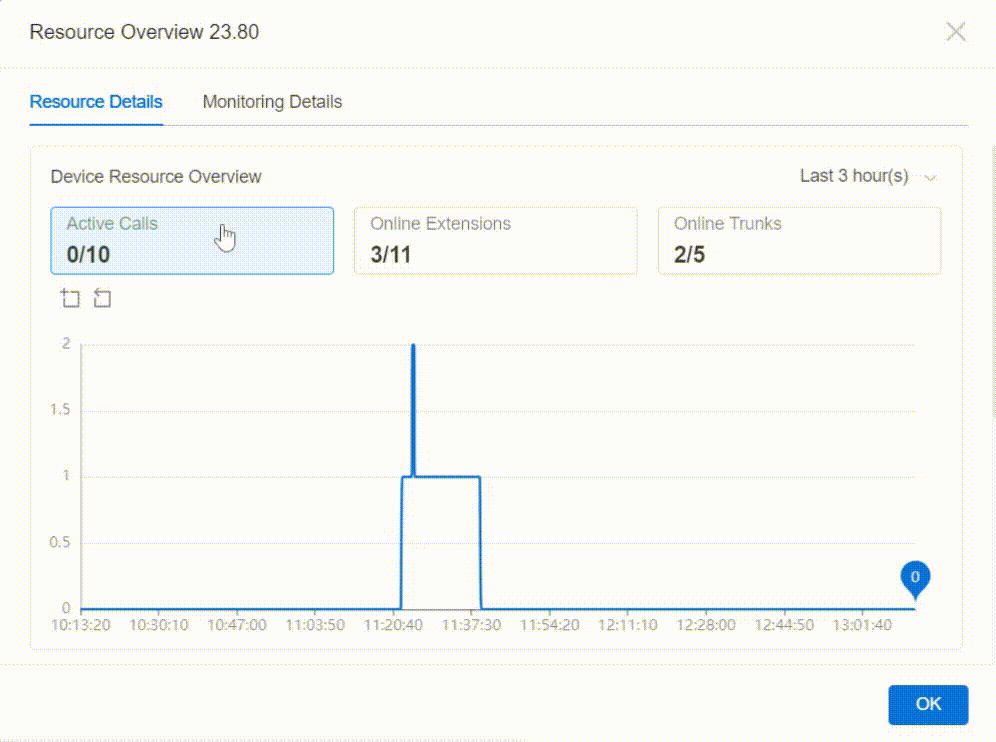
| Metric | Description |
|---|---|
| Active Calls | Show the ratio of the number of current active calls to the total number of concurrent calls supported, and provide the trends and details at each time point within the selected time frame. |
| Online Extensions | Show the ratio of the number of extensions currently
registered to the total number of extensions created, and
provide the trend as well as details at each time point within
the selected time frame. Sub-metrics:
|
| Online Trunks | Show the ratio of the number of connected SIP trunks to the
total number of SIP trunks created, and provide the trends and
details at each time point within the selected time
frame. Sub-metrics:
|
Check the historical utilization of concurrent calls
In the field, check the historical usage of concurrent calls in the last 24 weeks or the last 12 months.
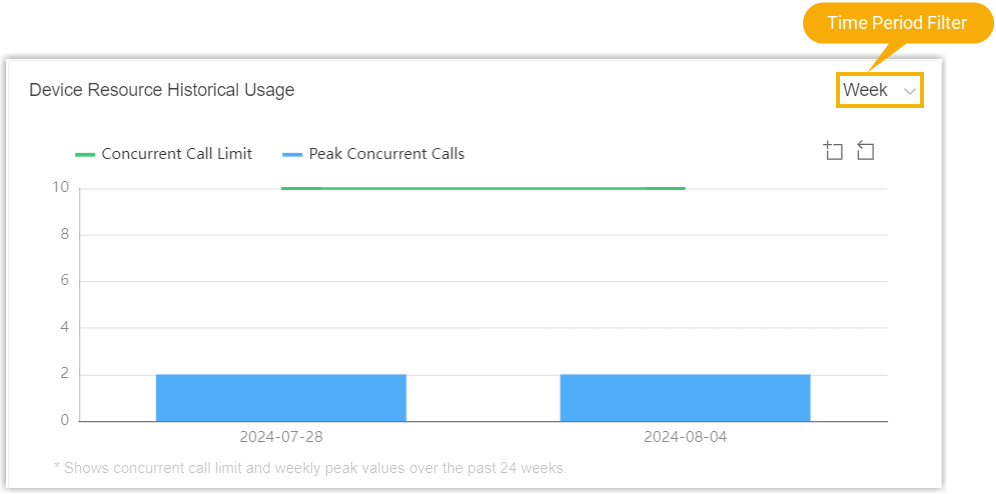
| Metric | Description |
|---|---|
| Concurrent Call Limit | Show the maximum number of concurrent calls supported by the PBX. |
| Peak Concurrent Calls | Show the maximum number of concurrent calls in the selected period. |
Check resource utilization of CPU, memory, and disk usage
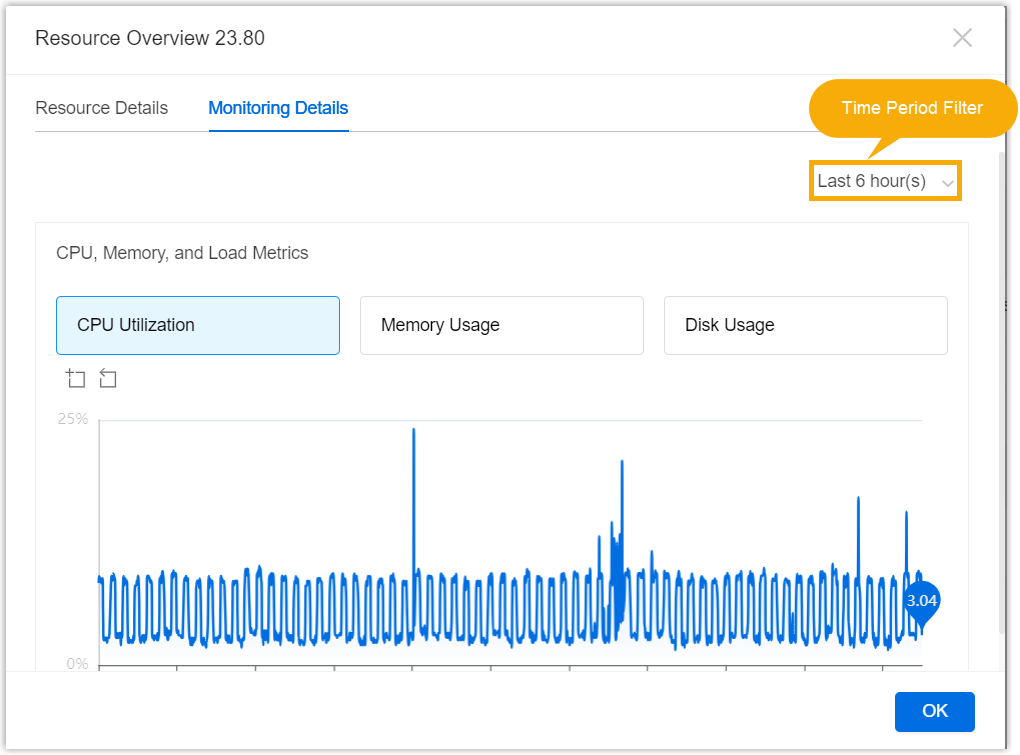
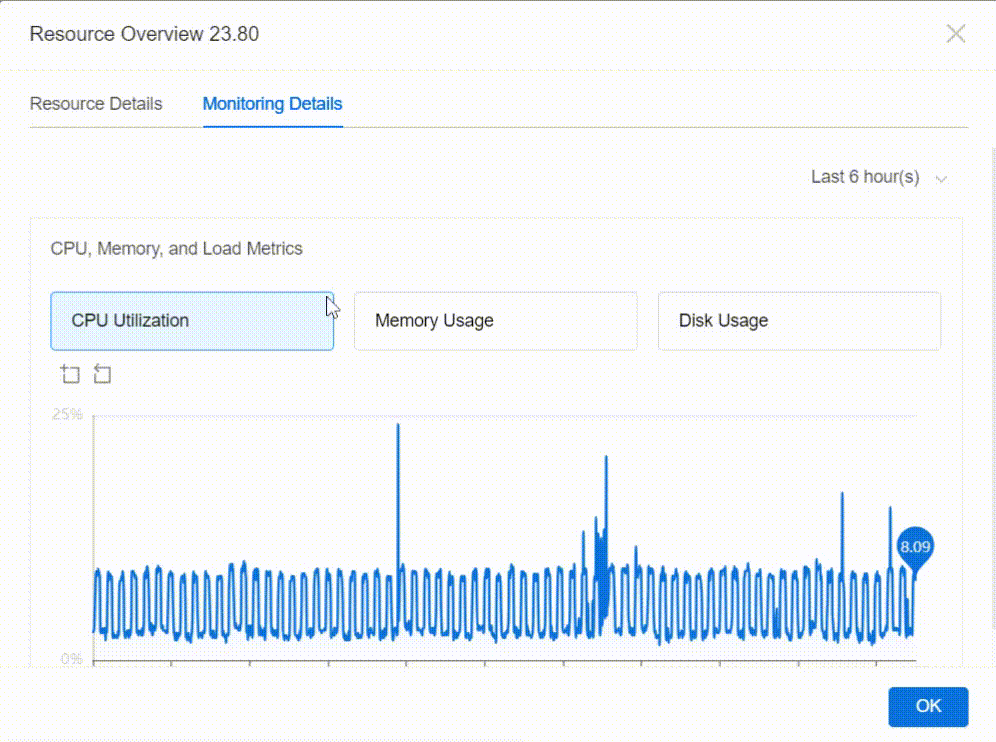
In the field, check the resource utilization and disk usage of the PBX in the last 1 hour, 6 hours, 12 hours, 24 hours, the last 3 days, 7 days, 14 days, or in a custom time period of up to 30 days.
| Metric | Description |
|---|---|
| CPU Utilization | Show the percentage of the CPU capacity utilization within the selected period. |
| Memory Usage | Show the percentage of the memory utilization within the selected period. |
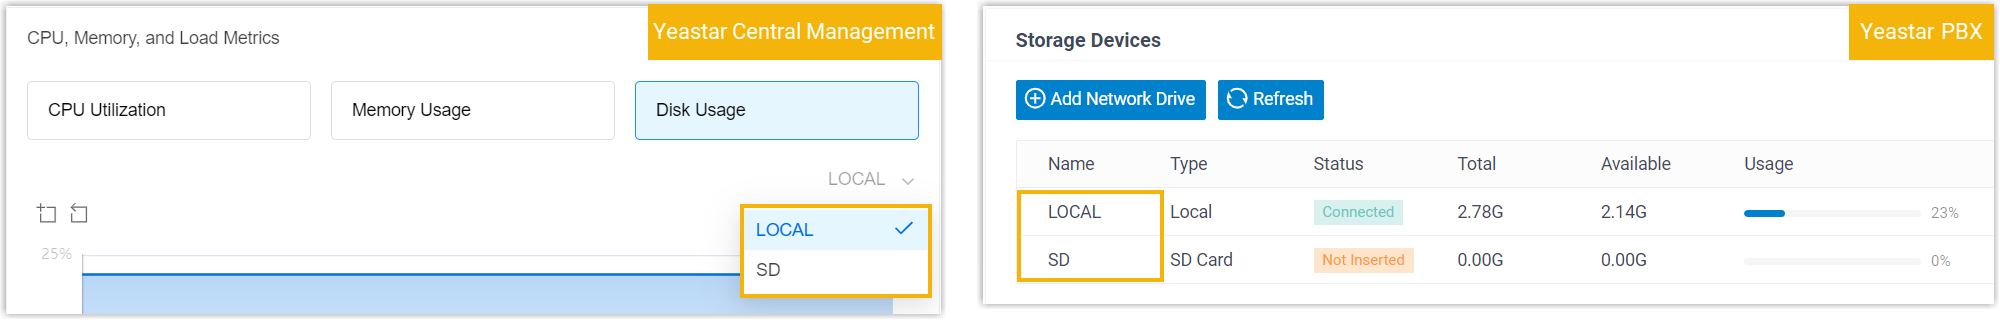
| Disk Usage | Show the percentage of disk space utilization within the
selected period. Note: You can select a
storage location from the drop-down list. The storage
locations displayed in the drop-down list are synchronized
from PBX web portal (Path: ).
|
Check network traffic of network interface
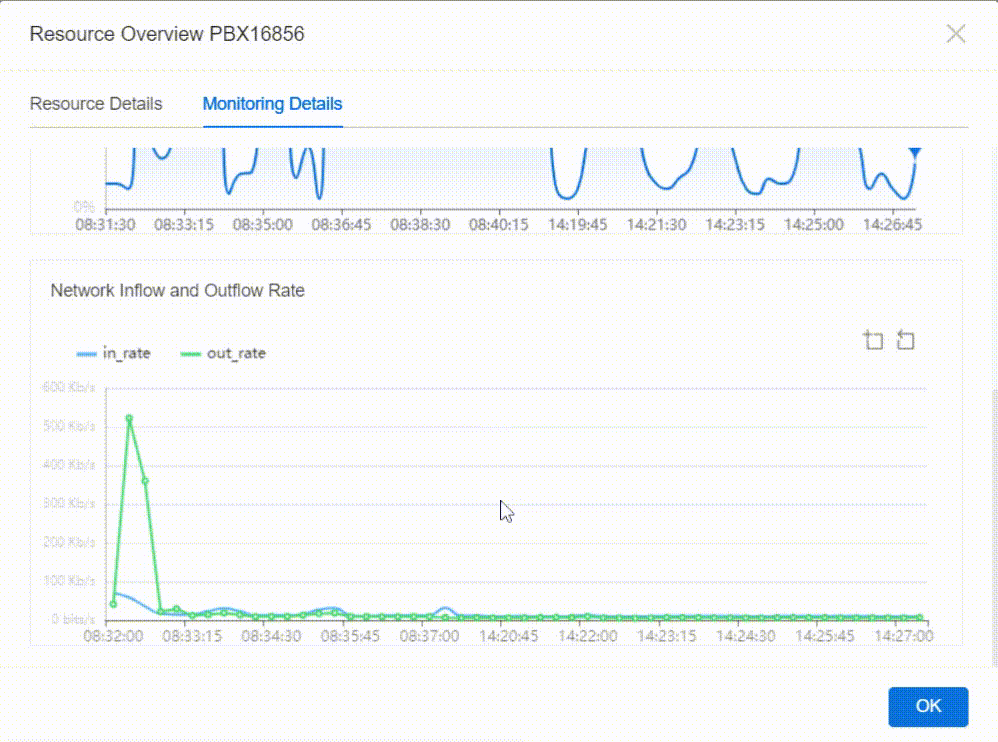
| Metric | Description |
|---|---|
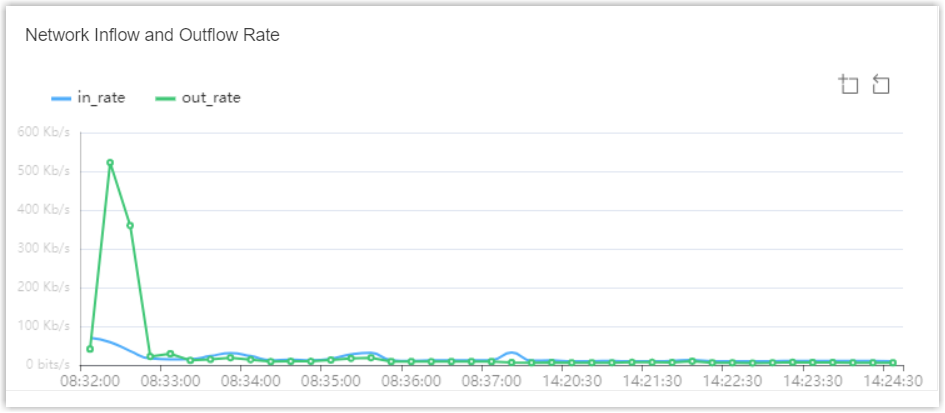
| in_rate |
Show the number of bits received by the network interface per second, namely the downstream bandwidth of the network interface. |
| out_rate |
Show the number of bits sent from the network interface per second, namely the upstream bandwidth of the network interface. |