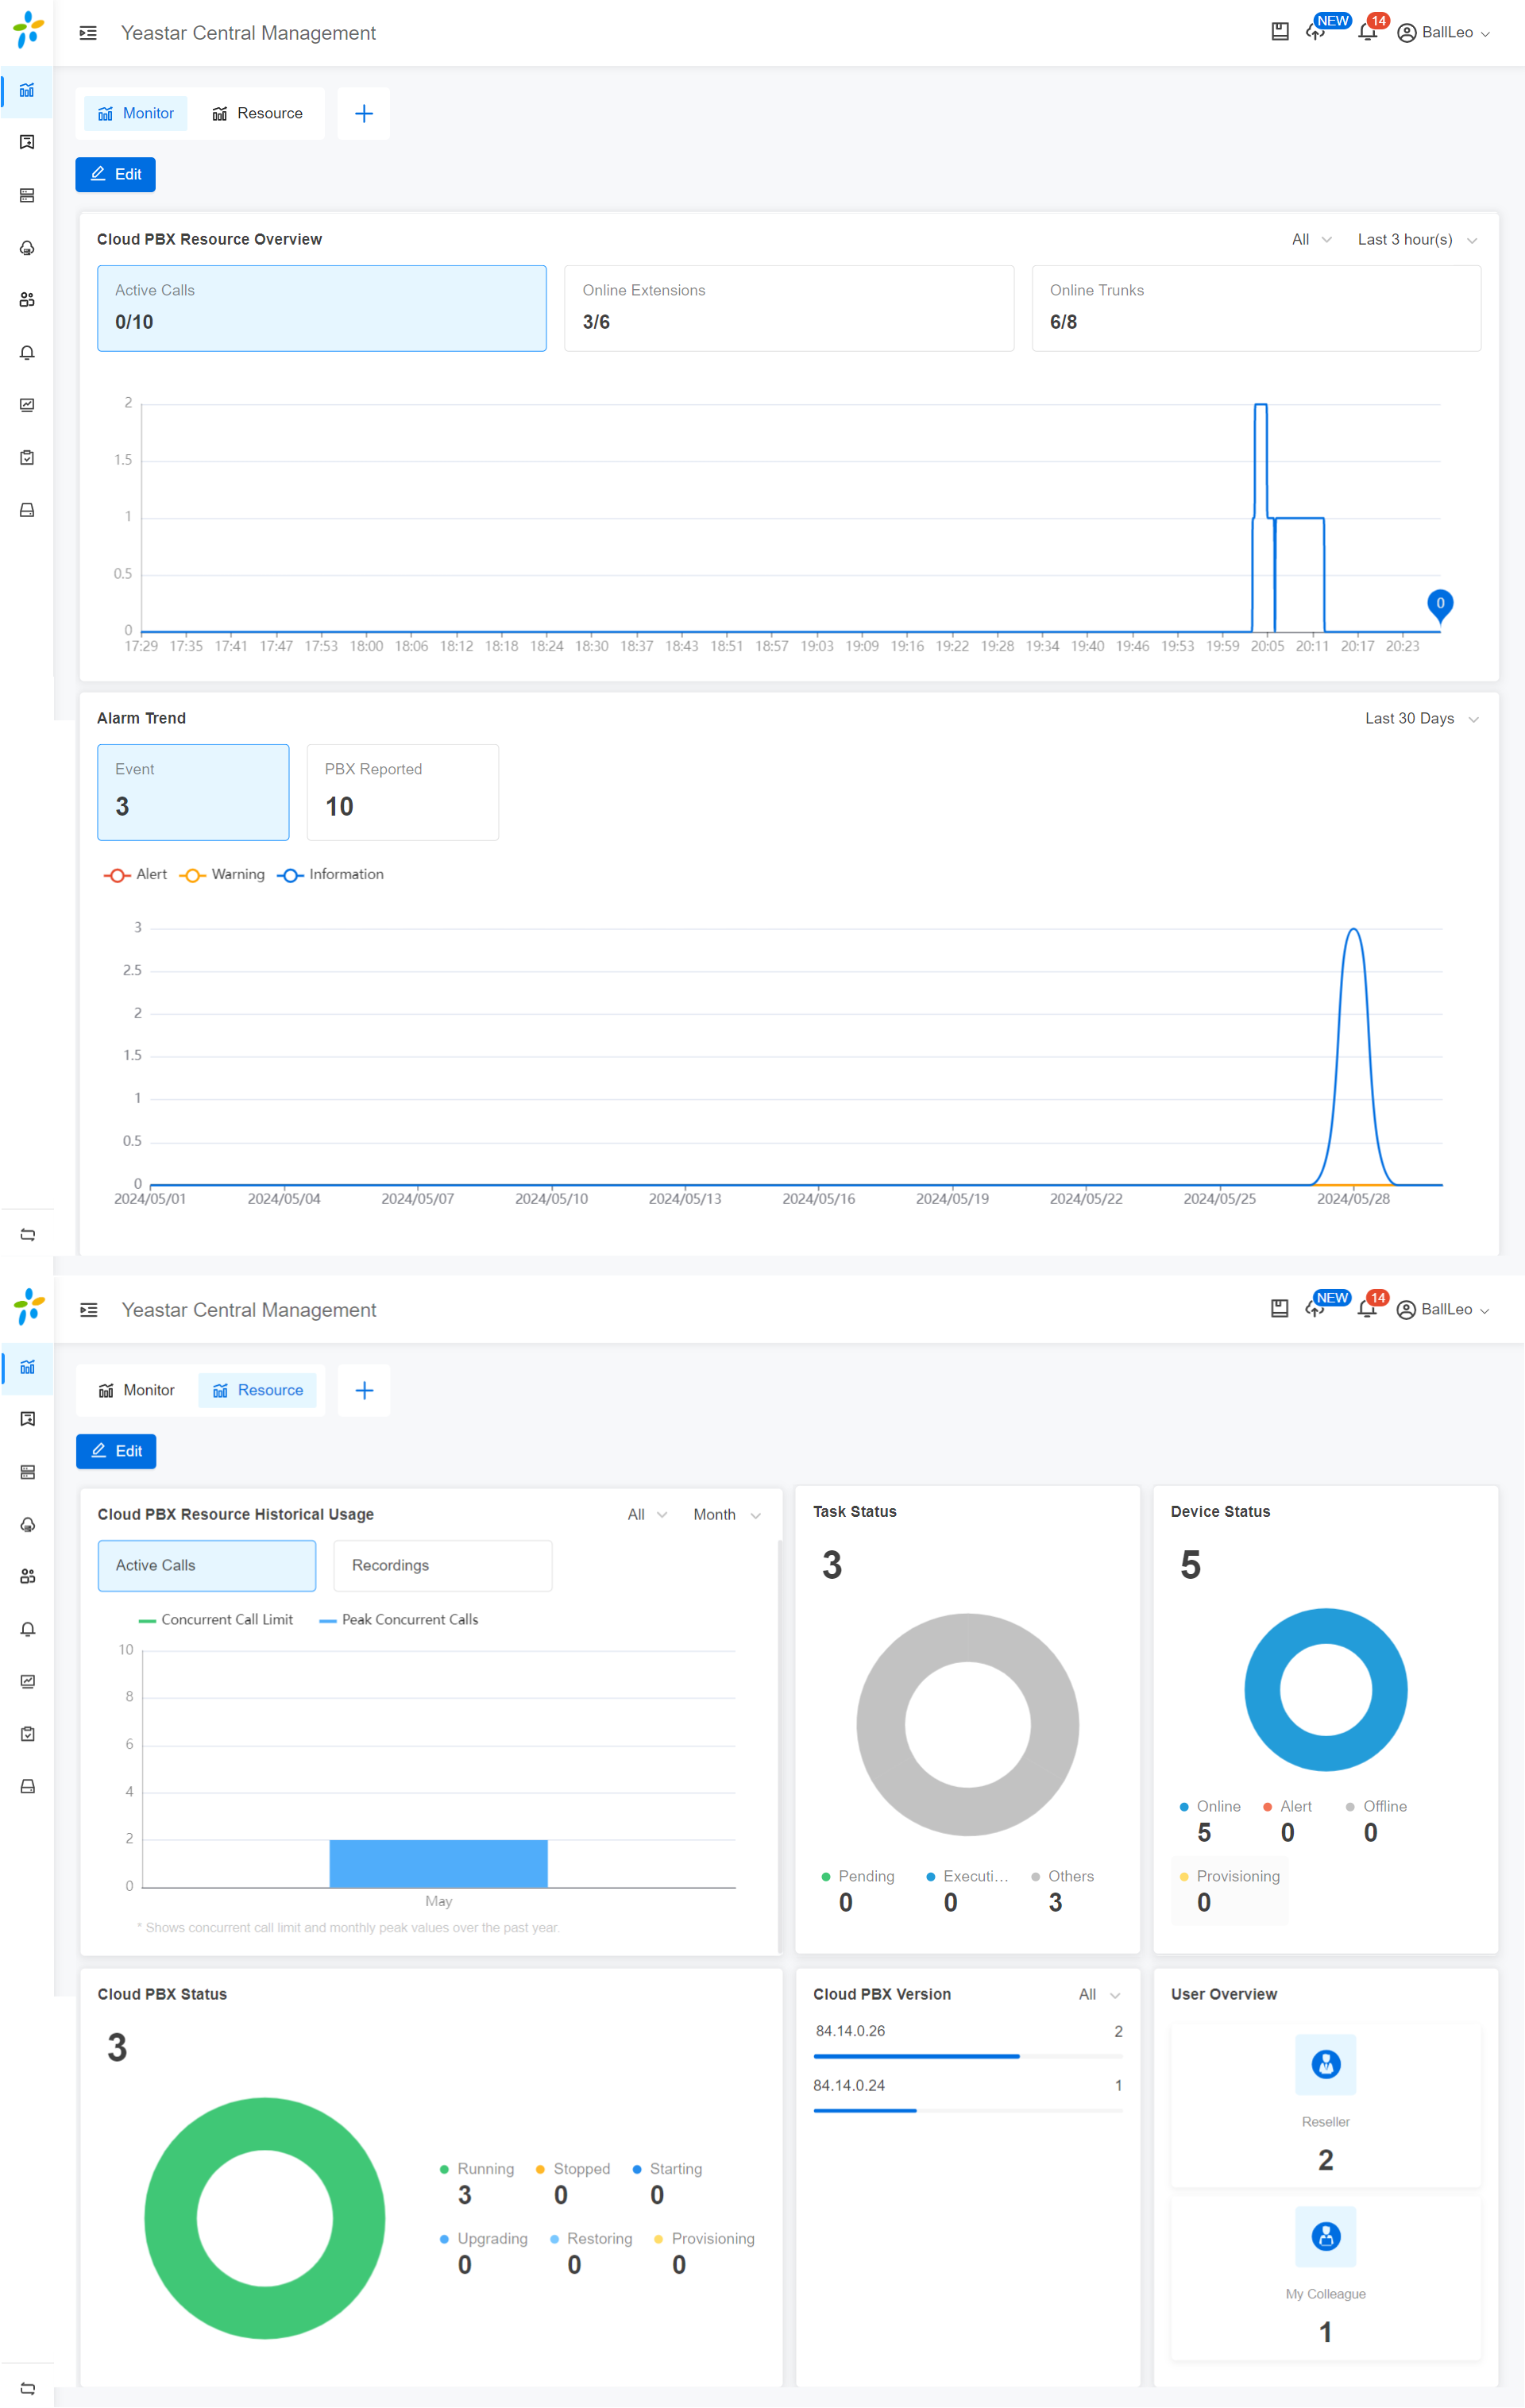
Dashboard is a collection of widgets that present you a real-time view of key
information and health status about your Yeastar Central Management, and allows you to
quickly access specific features within clicks.
Widgets on the Dashboard are mini-reports that visualize and summarize the data that you
care about most.
Tip: To help you understand the metrics, we will
explain them in detail. You can click a specific metric on the image below to
quickly check the corresponding description.
Monitor Dashboard
Resources Dashboard
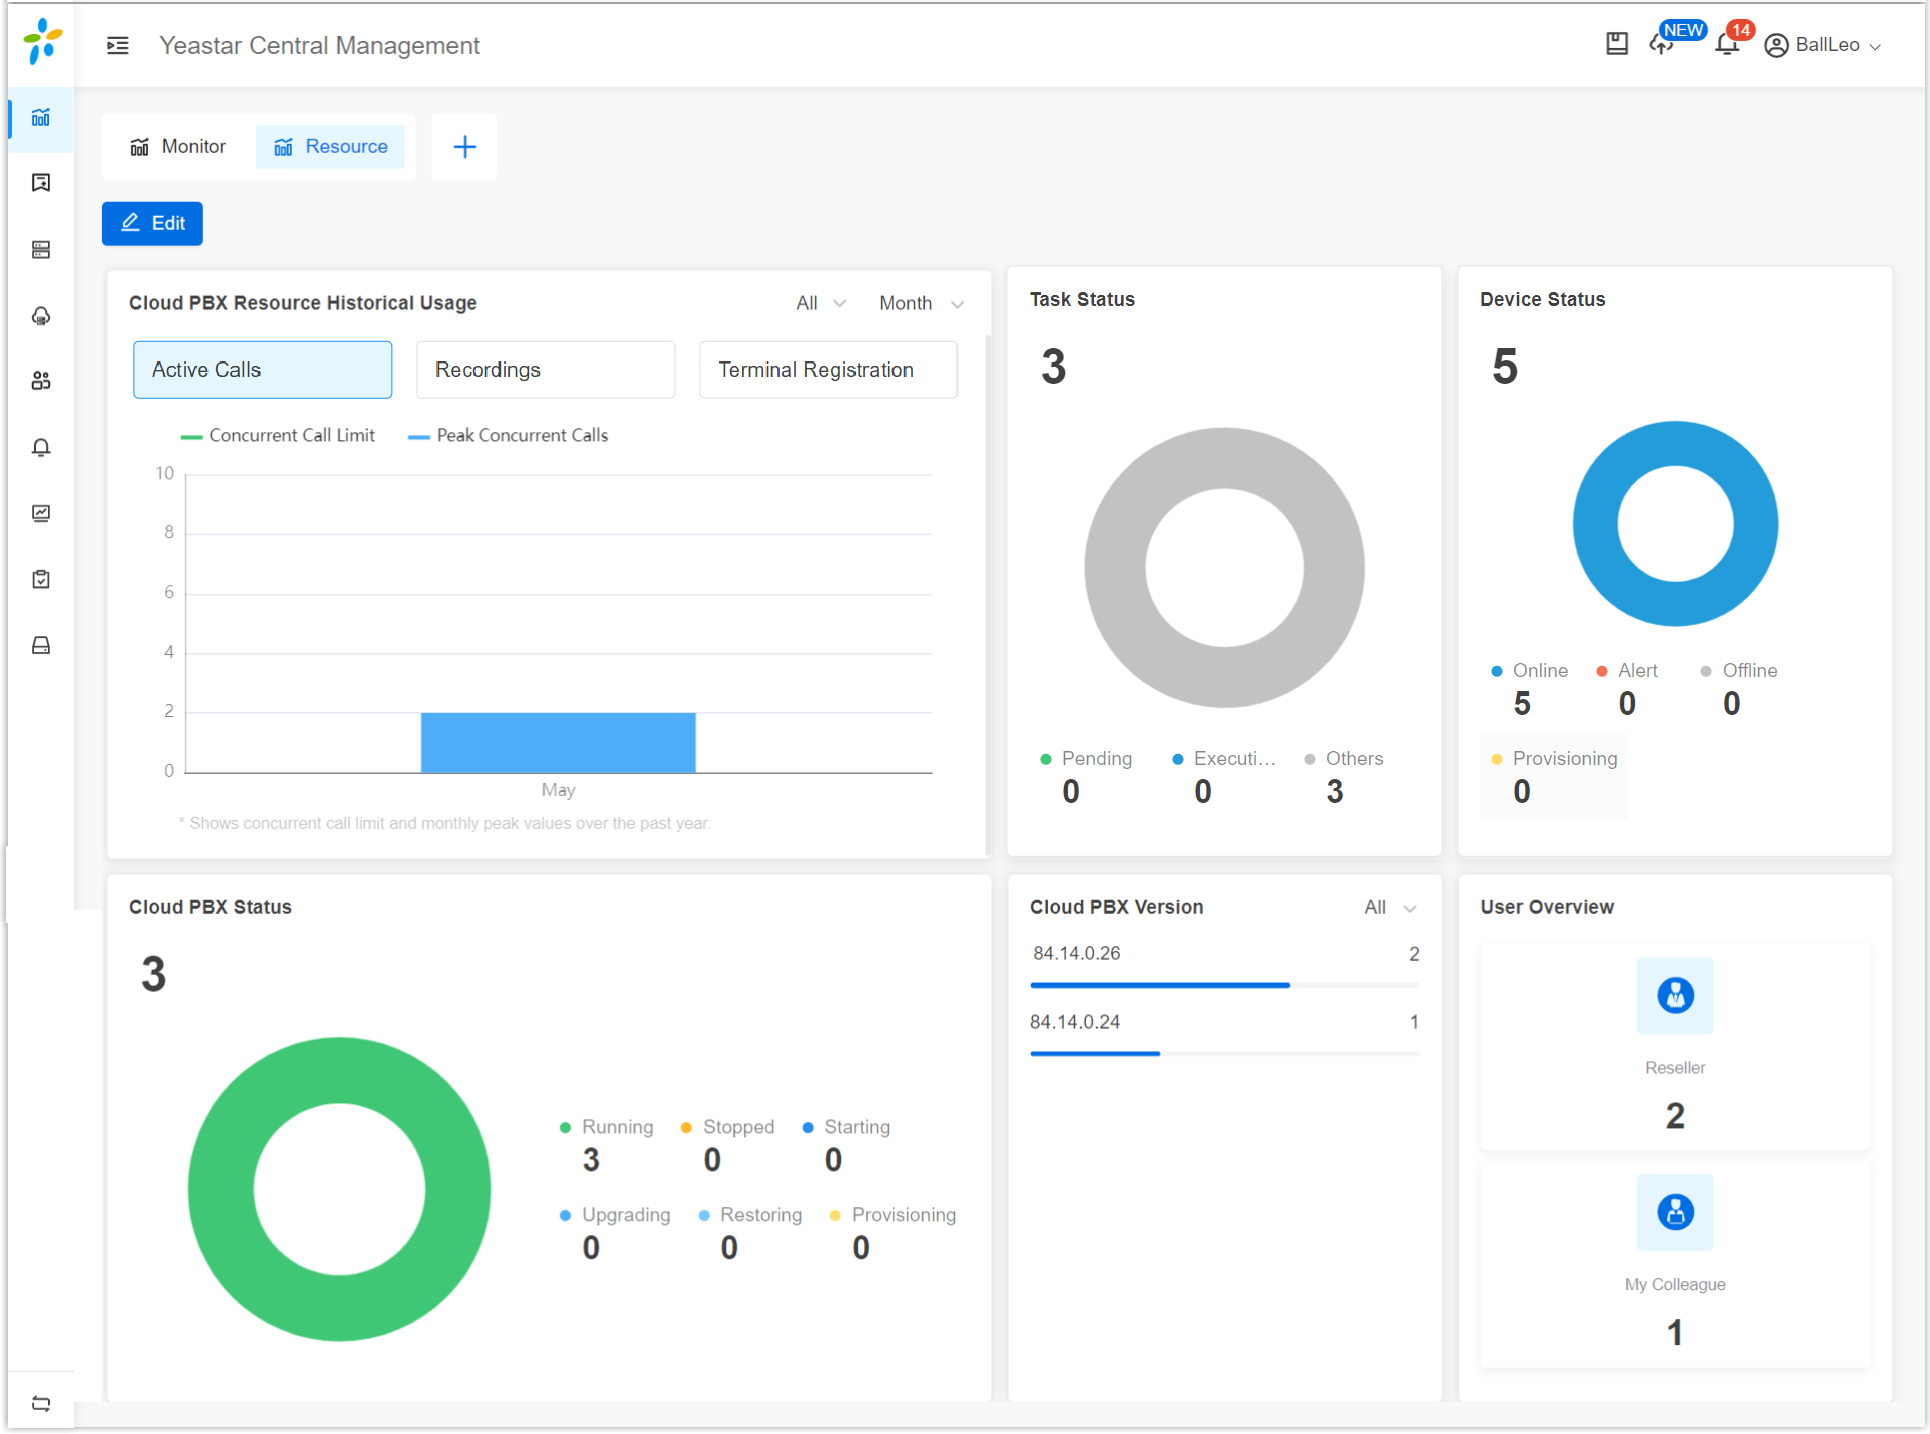
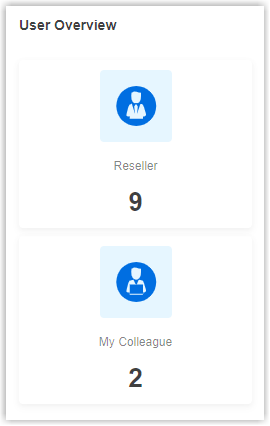
User Overview
Sum up the colleagues with Yeastar Central Management
permission and resellers, who are created by yourself.
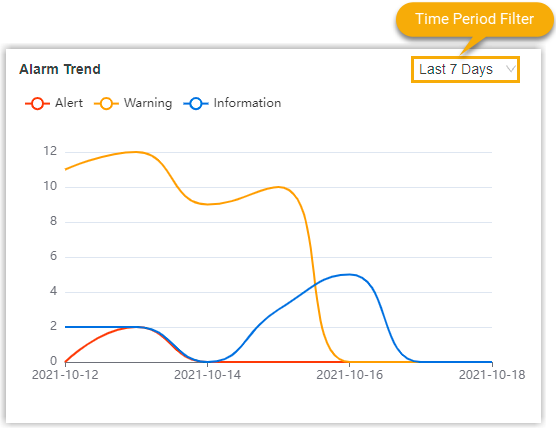
Alarm Trend
Sum up the number of different types of alarms that were triggered in the last 6
hours, the day, the last 7 days, 15 days, or 30 days.
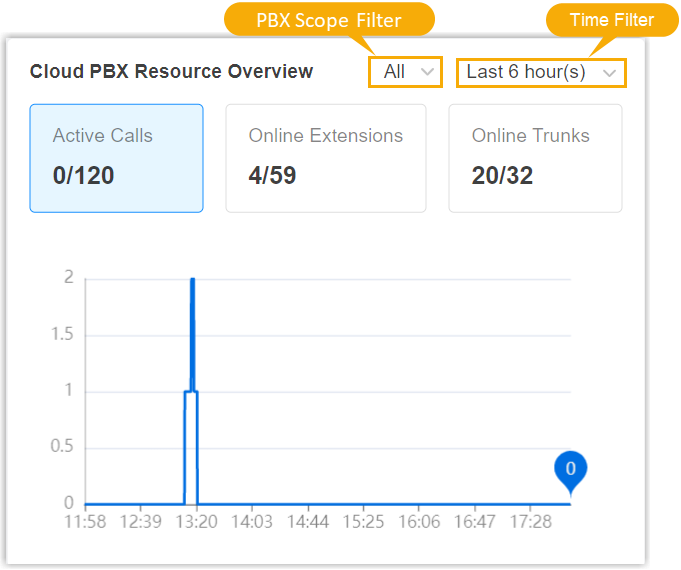
Cloud PBX Resource Overview
Sum up the current utilization of active calls (concurrent calls), extensions, and
trunks on the P-Series Cloud PBXs within the selected scope, and display the trend
line of active calls in the last 1 hour, 3 hours, 6 hours, 12 hours, 24 hours.
Note: The system only monitors data from P-Series Cloud PBXs
with firmware version 84.15.0.22 or later.

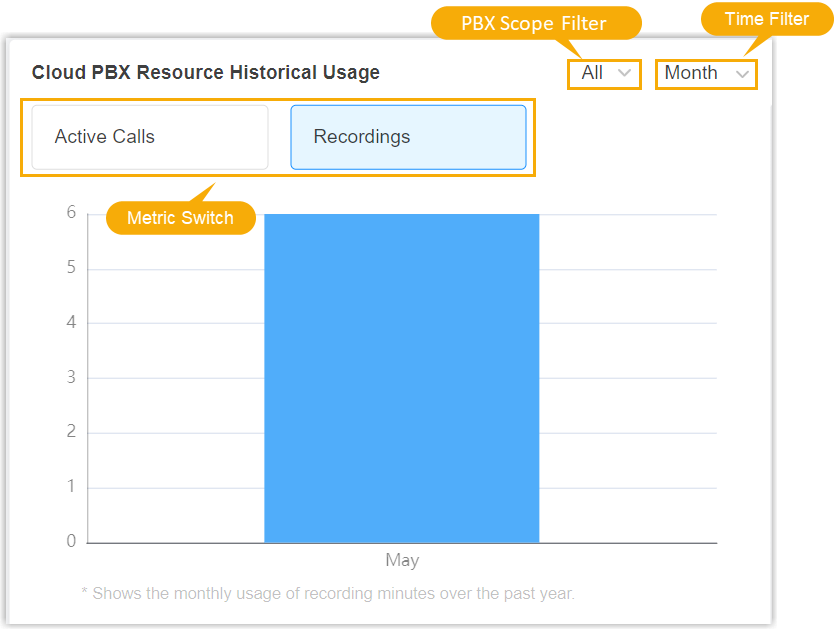
Cloud PBX Resource Historical Usage
Display the historical utilization of active calls (concurrent calls), recording
minutes, and peak registration number for each terminal type on the P-Series Cloud
PBXs within the selected scope over the last 24 weeks or the last 12 months.
Note: The system collects the following metrics from cloud PBXs,
but only if they meet the firmware requirements:
-
It collects data on concurrent calls and recording minutes from PBXs
with firmware 84.15.0.22 or later.
-
It additionally collects data on peak registration number from PBXs
with firmware 84.21.0.66 or later.
Shared Trunk Resource Overview
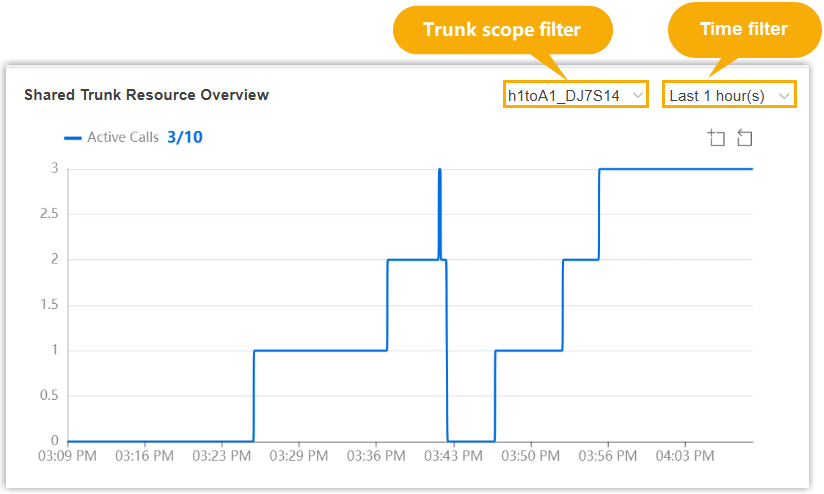
Display the current concurrent call usage and limit of shared trunks within the
selected scope (e.g.,
all accessible
trunks,
accessible trunks in a specific region, trunks assigned to a specific PBX
or subordinate user, or a specific
trunk), and display the real-time usage trend over the last 1 hour, 3 hours, 6
hours, 12 hours, or 24 hours.
Note: The system only monitors
data from P-Series Cloud PBXs with firmware version 84.23.0.123 or
later.

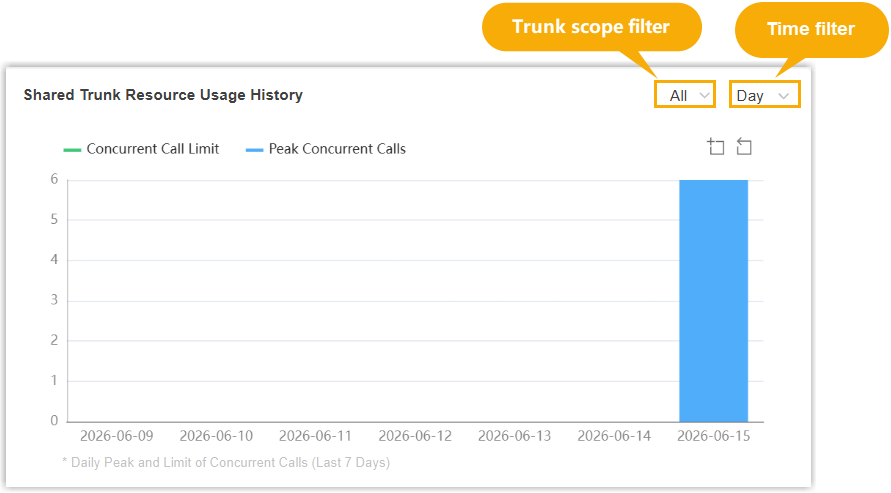
Shared Trunk Resource Usage History
Display the peak concurrent call usage and limit of shared trunks within the selected
scope (e.g.,
all accessible trunks,
accessible trunks in a specific region, trunks assigned to a specific PBX
or subordinate user, or a specific
trunk) over the last 7 days, the last 24 weeks, or the last 12 months.
Note: The system only monitors
data from P-Series Cloud PBXs with firmware version 84.23.0.123 or
later.

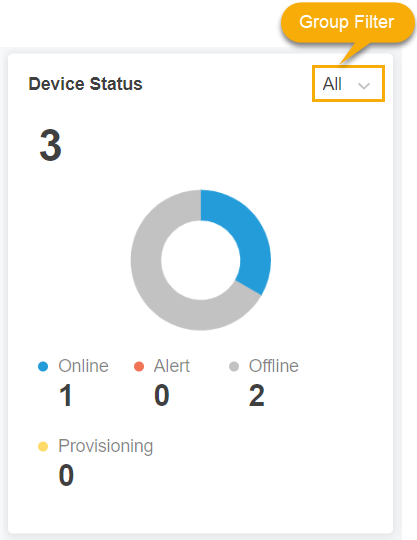
Device Status
Sum up and classify the remote PBXs and gateways that you have added to the
system by status.
Task Status
Sum up and classify the tasks that you have scheduled for P-Series PBX
Systems by status.
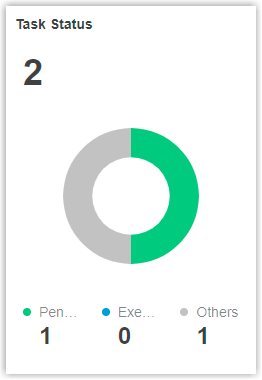
Note: Suspended,
Finished, Terminating, and
Terminated tasks are all displayed as
Others.

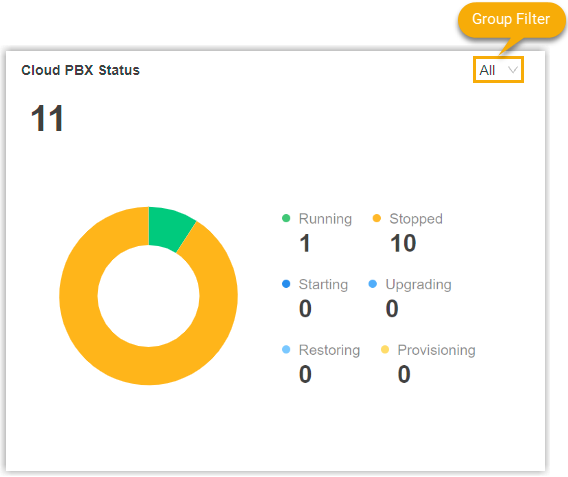
Cloud PBX Status
Sum up and classify the P-Series Cloud PBXs by status.
Cloud PBX Version
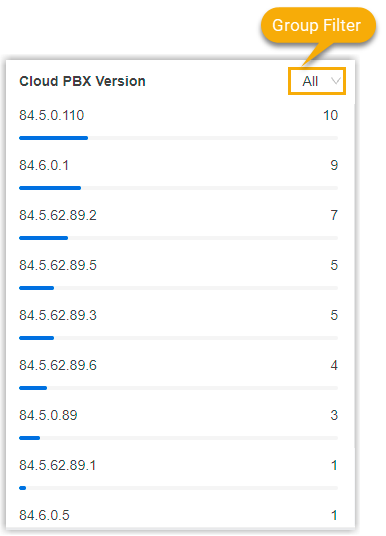
Display the top 9 firmware versions in frequency of use and the number of PBX for
each version.
Note: If there are more than 9 firmware versions,
the rest is displayed as Others.

Yeastar Partner Portal Toggle Button
Switch to the web interface of Yeastar Partner Portal without entering
credentials again.