View and Analyze SIP Traffic with Homer
Once connected to Yeastar Central Management, Homer captures all the SIP traffic associated with P-Series Cloud PBXs reported by the cluster servers and presents the data within its web interface for analysis. This topic describes how to use the Homer's intuitive web interface to drill down into the SIP traffic, including raw messages, SIP sequence diagrams, and data export, helping you quickly troubleshoot communication issues through visual data.
Requirements
- The firmware of Yeastar Central Management is 87.17.0.22 or later.
- The firmware of P-Series Cloud PBX is 84.20.0.128 or later.
- You have enabled Homer monitoring on Yeastar Central Management.
Procedure
- Access the Homer web interface.
- Log in to Yeastar Central Management, go to .
- At the top-right corner of the webpage, click Manage
Homer.
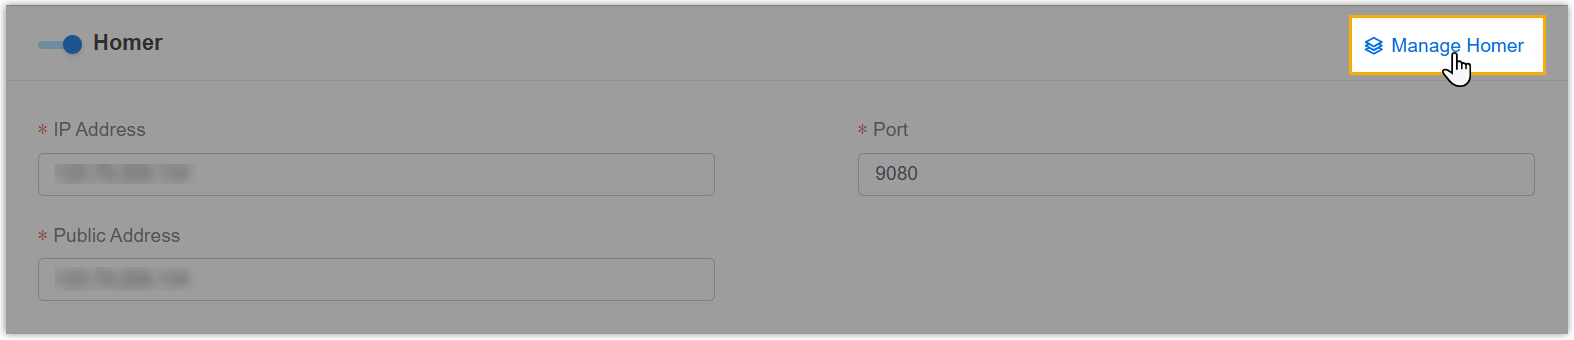
You are redirected to the Homer web interface directly without the need to entering credentials, and the captured SIP traffic is presented as session-based lists of detailed SIP messages.
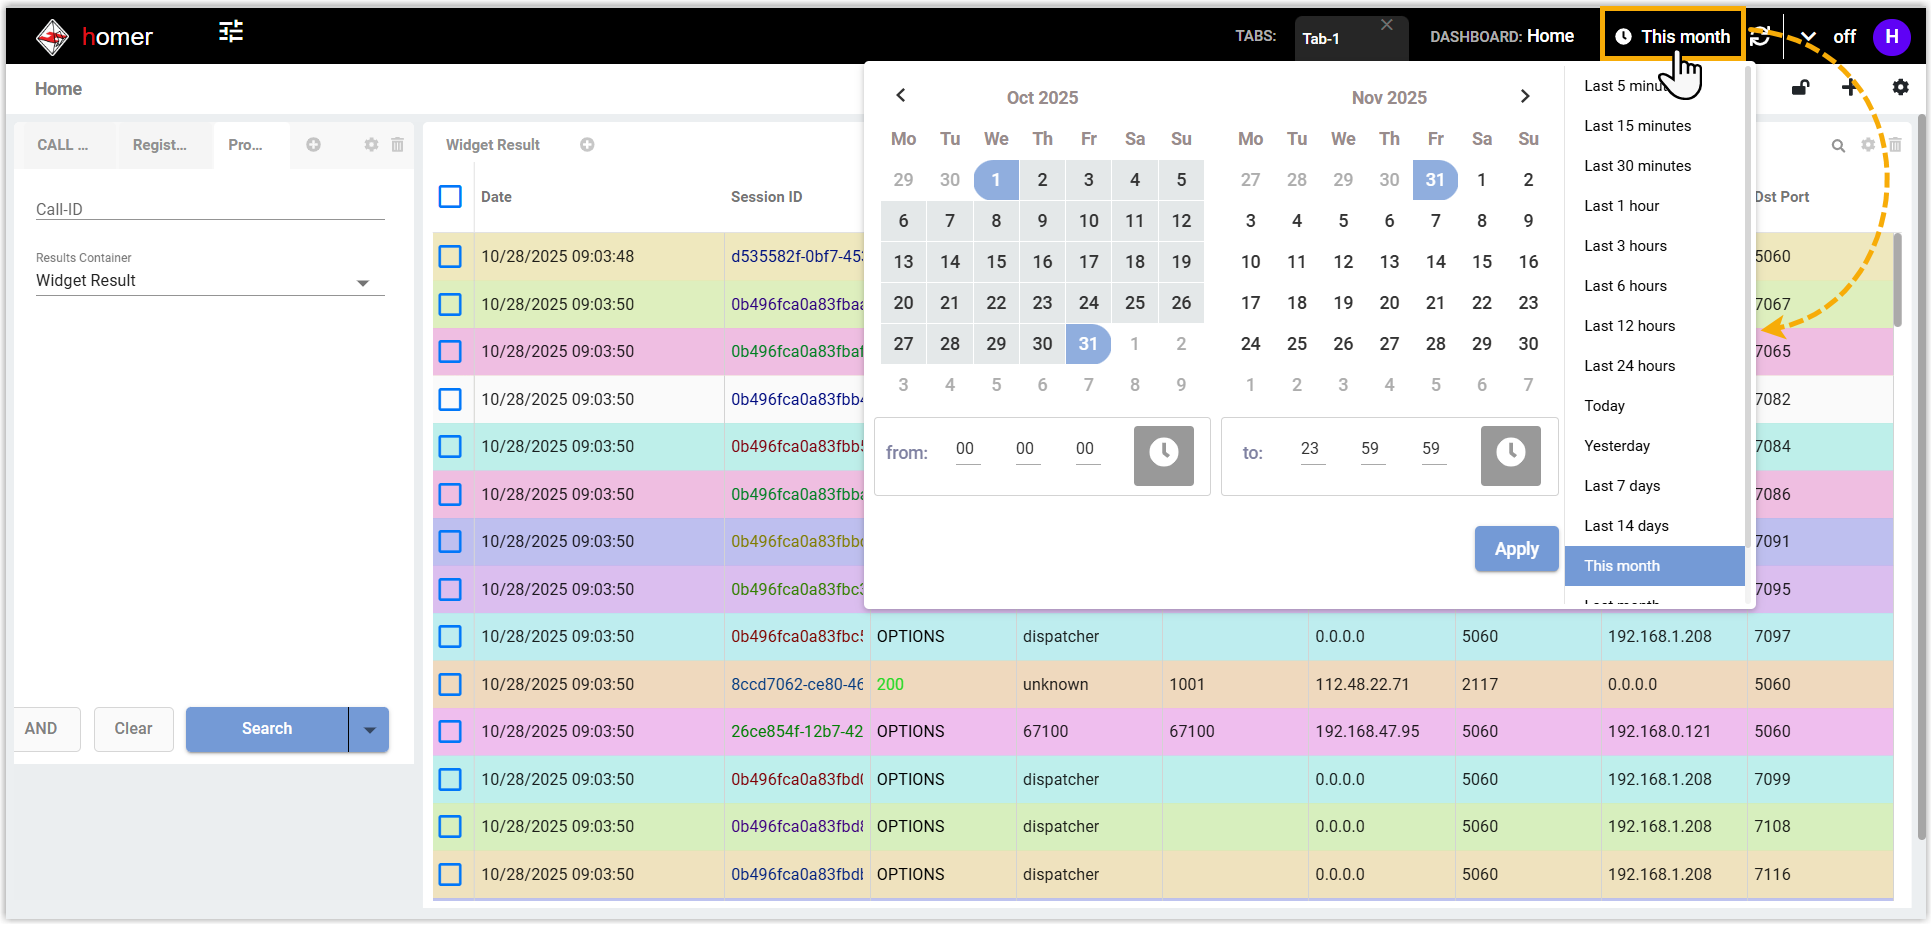
- Optional: At the top-right corner of the Homer web
interface, specify a time range to narrow down the records.
- View and analyze specific SIP sessions based on your troubleshooting
needs.Note: In the session details, IP addresses of entities are displayed as follows:
-
SBC/SBC Proxy servers:
0.0.0.0 -
P-Series Cloud PBX: Its private IP address
-
Linkus web clients:
127.0.0.1(localhost)
-
Troubleshoot call issues
- In the left panel of the Homer dashboard, filter for the target session.Note: The dashboard displays a maximum of 200 records per page, you can use precise search criteria to locate specific sessions.
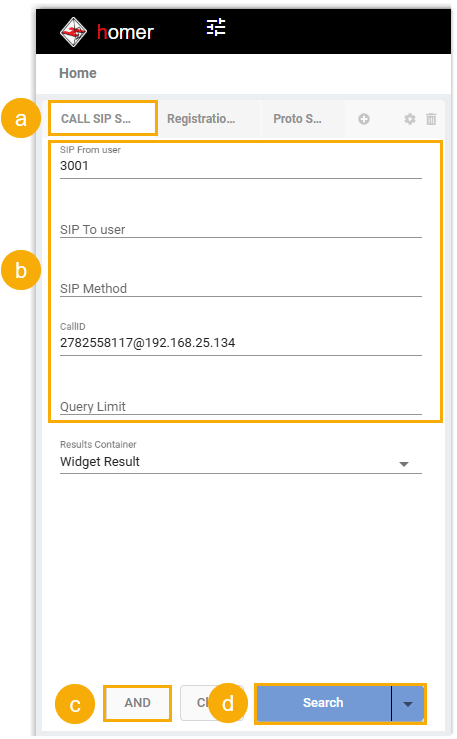
- Click the Call SIP Search tab.
- Optional: Set the filter criteria.
- SIP From user: The originator of the call (e.g., caller number).
- SIP To user: The destination of the call (e.g., callee number).
- SIP Method: Specific SIP request type
(e.g.,
INVITE,BYE,CANCEL) - CallID: The ID of the call.
- Query Limit: The maximum number of records to return.
- Optional: Toggle the logic button (AND / OR) to define the logical relationship between multiple filter criteria.
- Click Search.
- In the right panel of the Homer dashboard, view and analyze the desired
session.
- In the list, click the session ID of a session to open its
details.
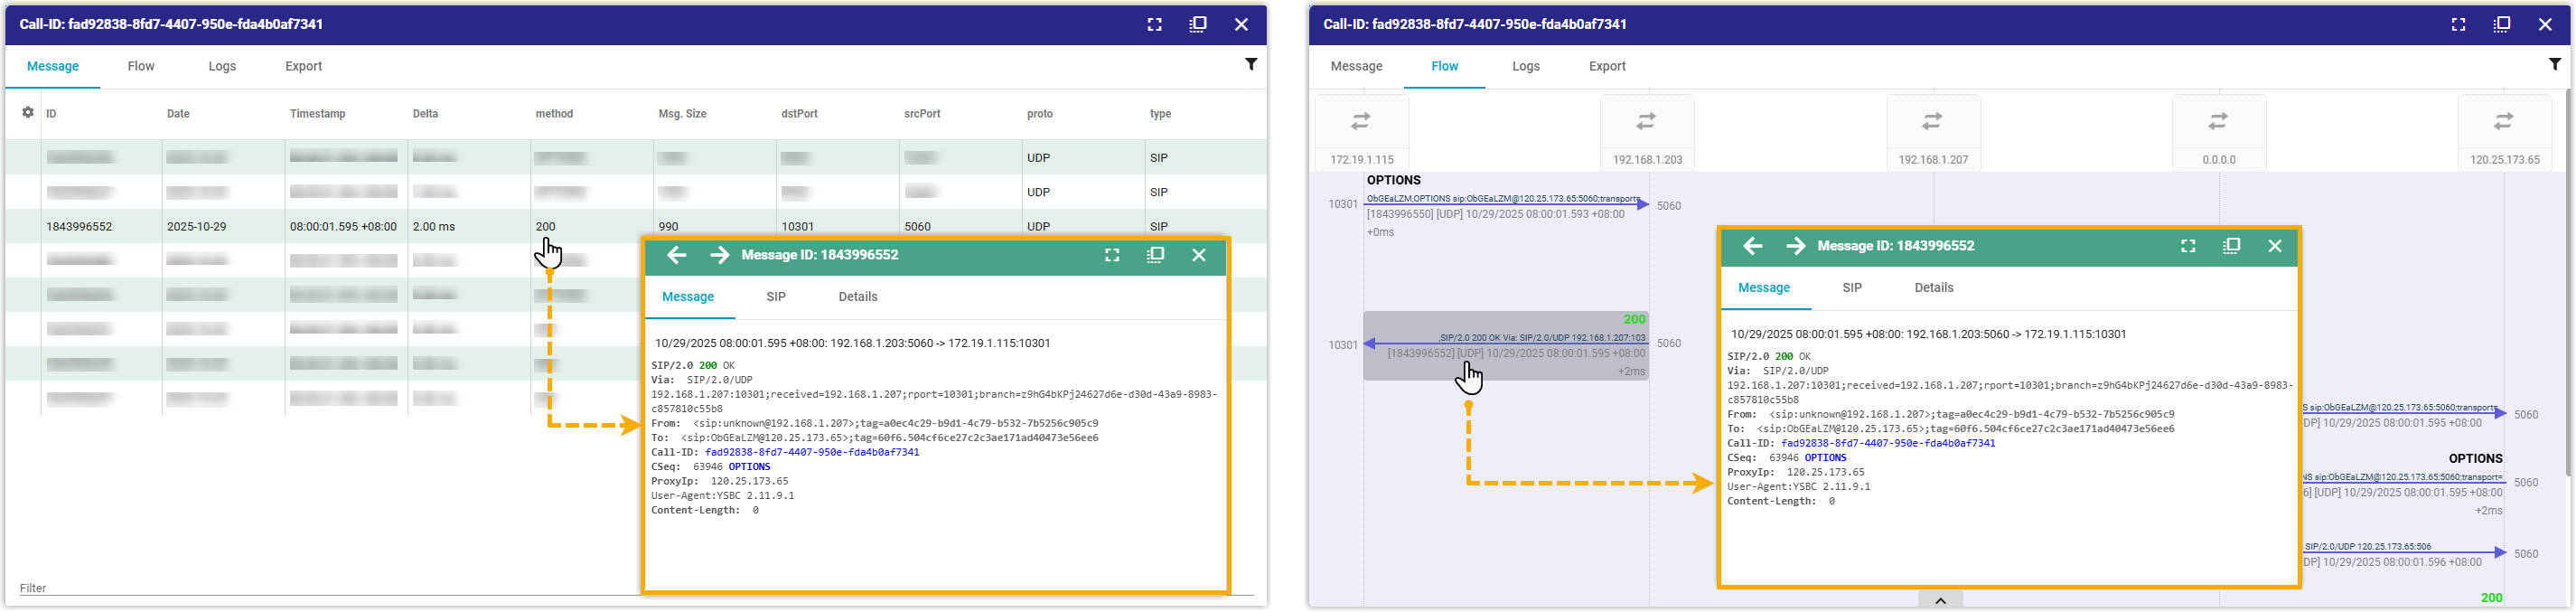
A pop-up window appears, presenting a visual SIP sequence diagram of the complete session flow for intuitive analysis.
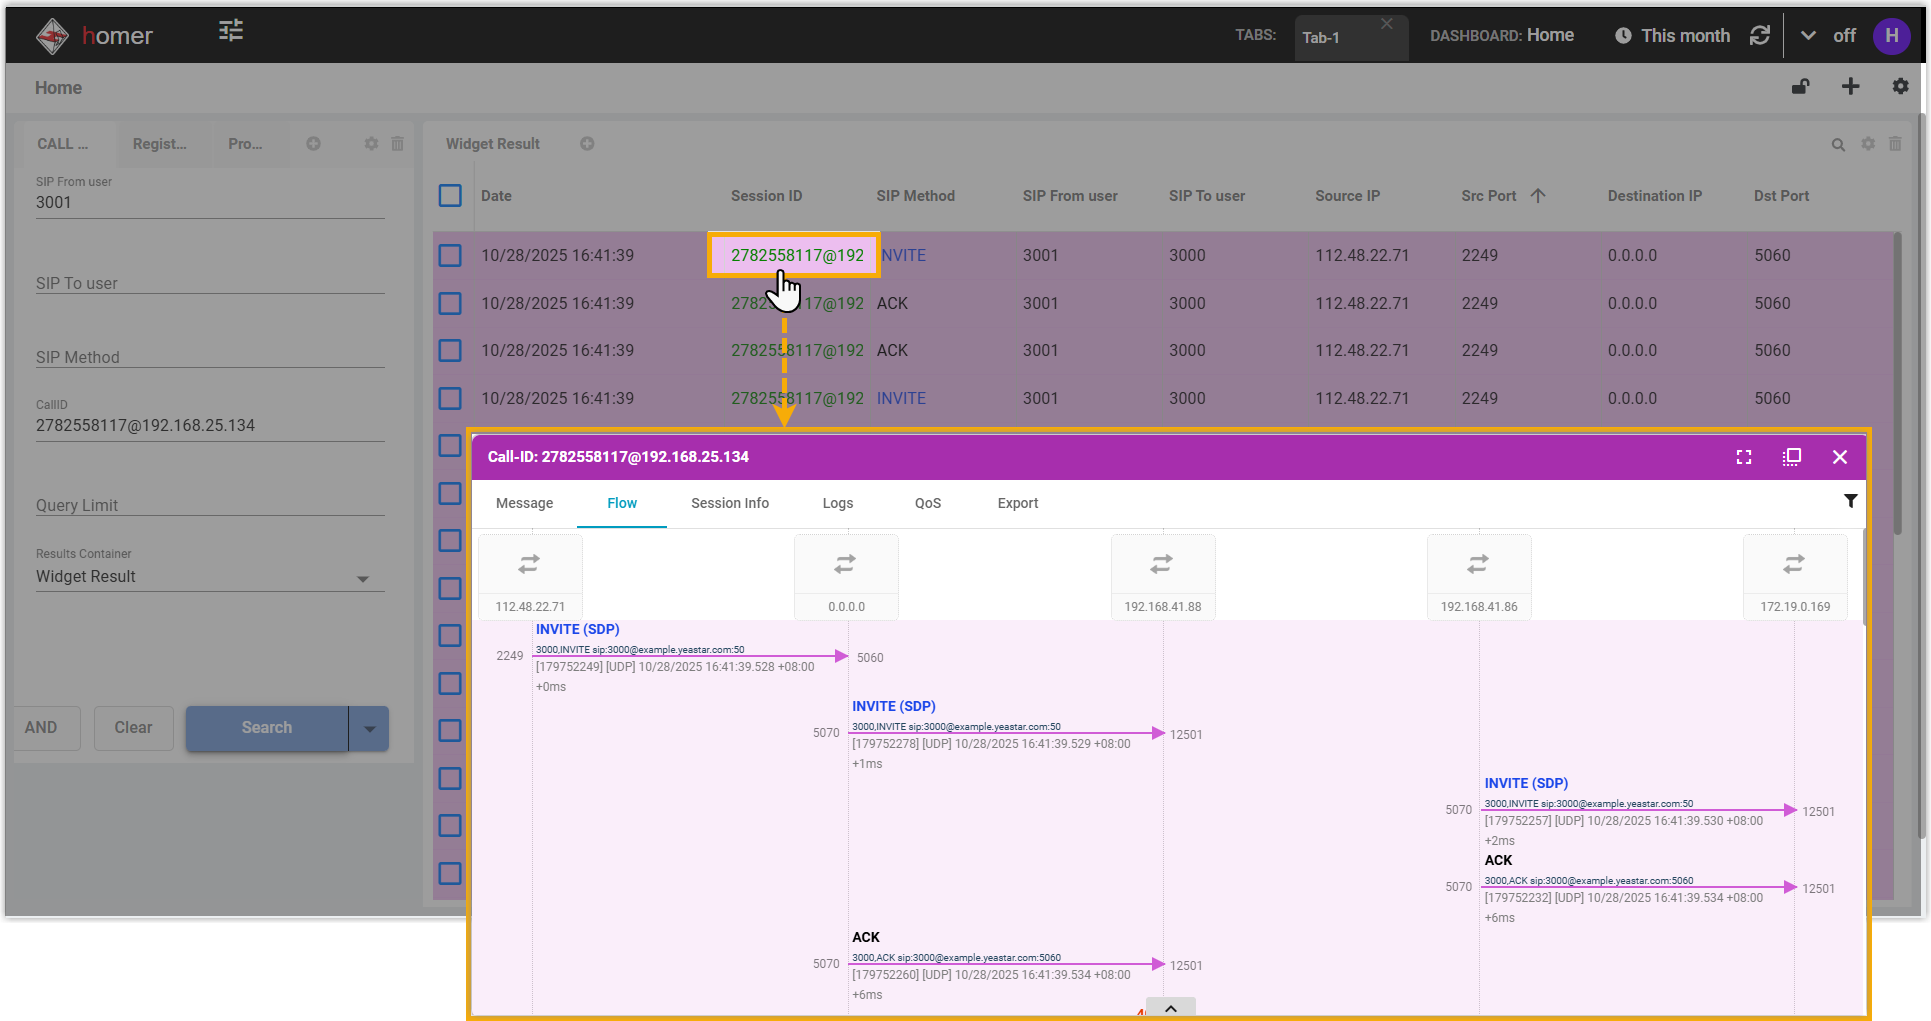
- Inspect the call flow.
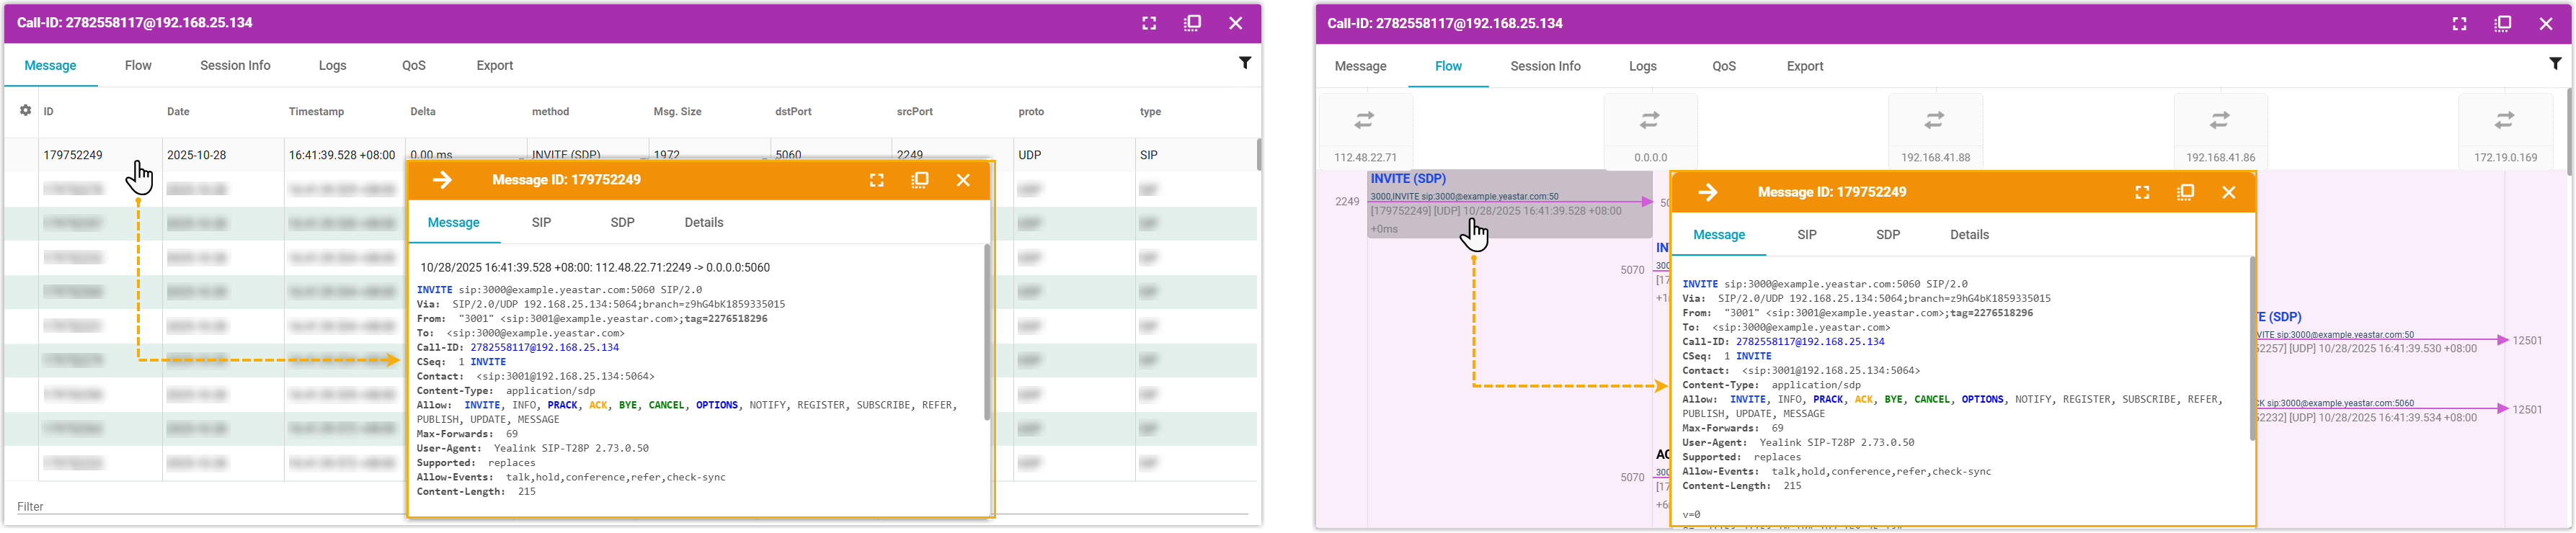
- To examine SIP message details, click the specific message
in the Message or
Flow tab.
A details panel opens, displaying the complete headers and body content of the selected SIP message.
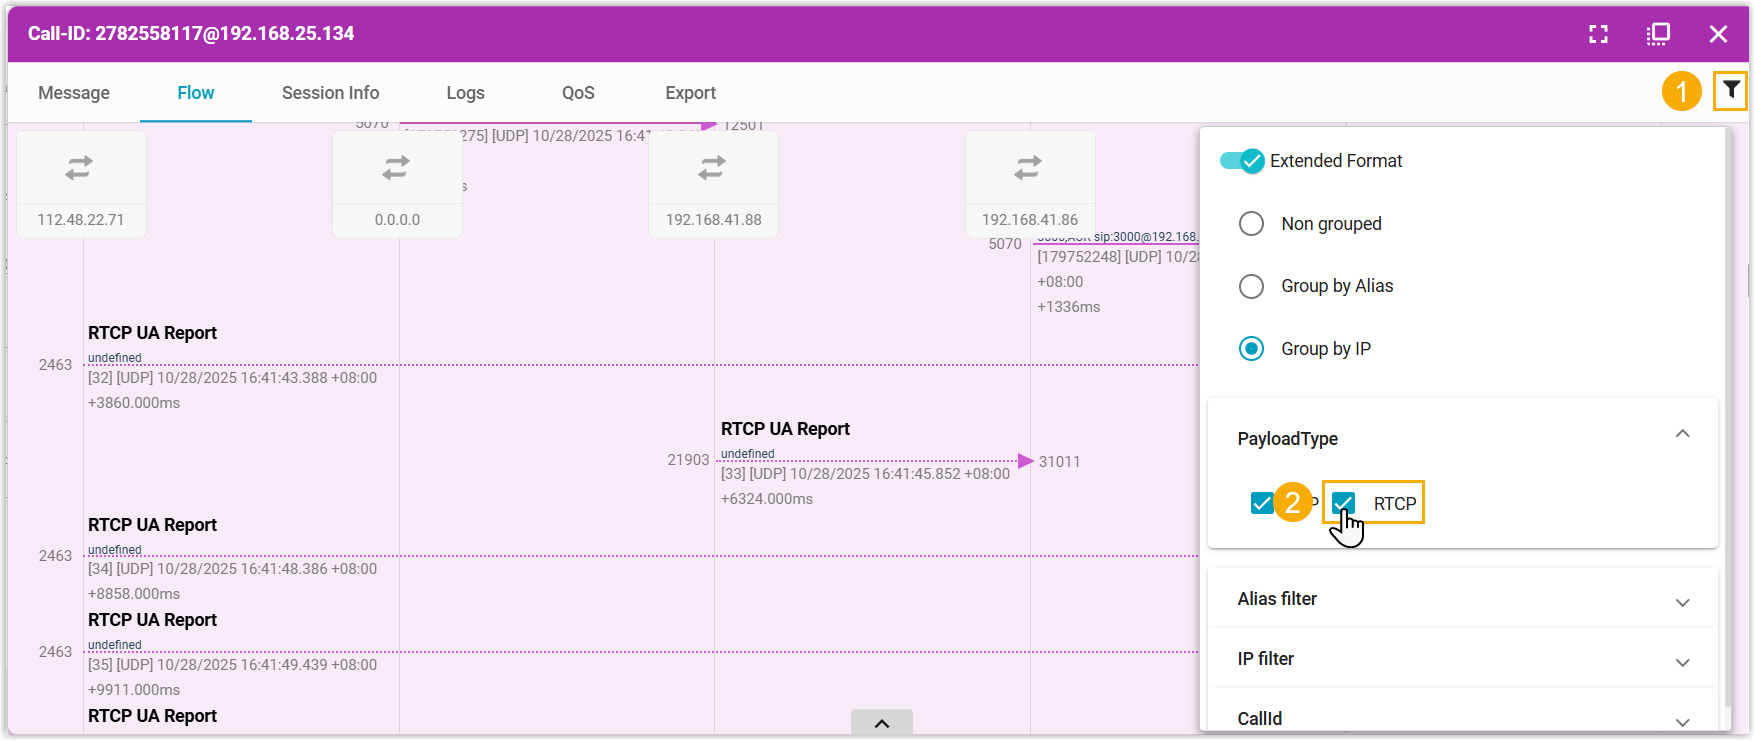
- To examine RTCP streams, click
 at the top-right corner of the
Flow tab and select the checkbox
of RTCP.
at the top-right corner of the
Flow tab and select the checkbox
of RTCP.The corresponding RTCP packets of the call will then be displayed below the main call flow diagram.
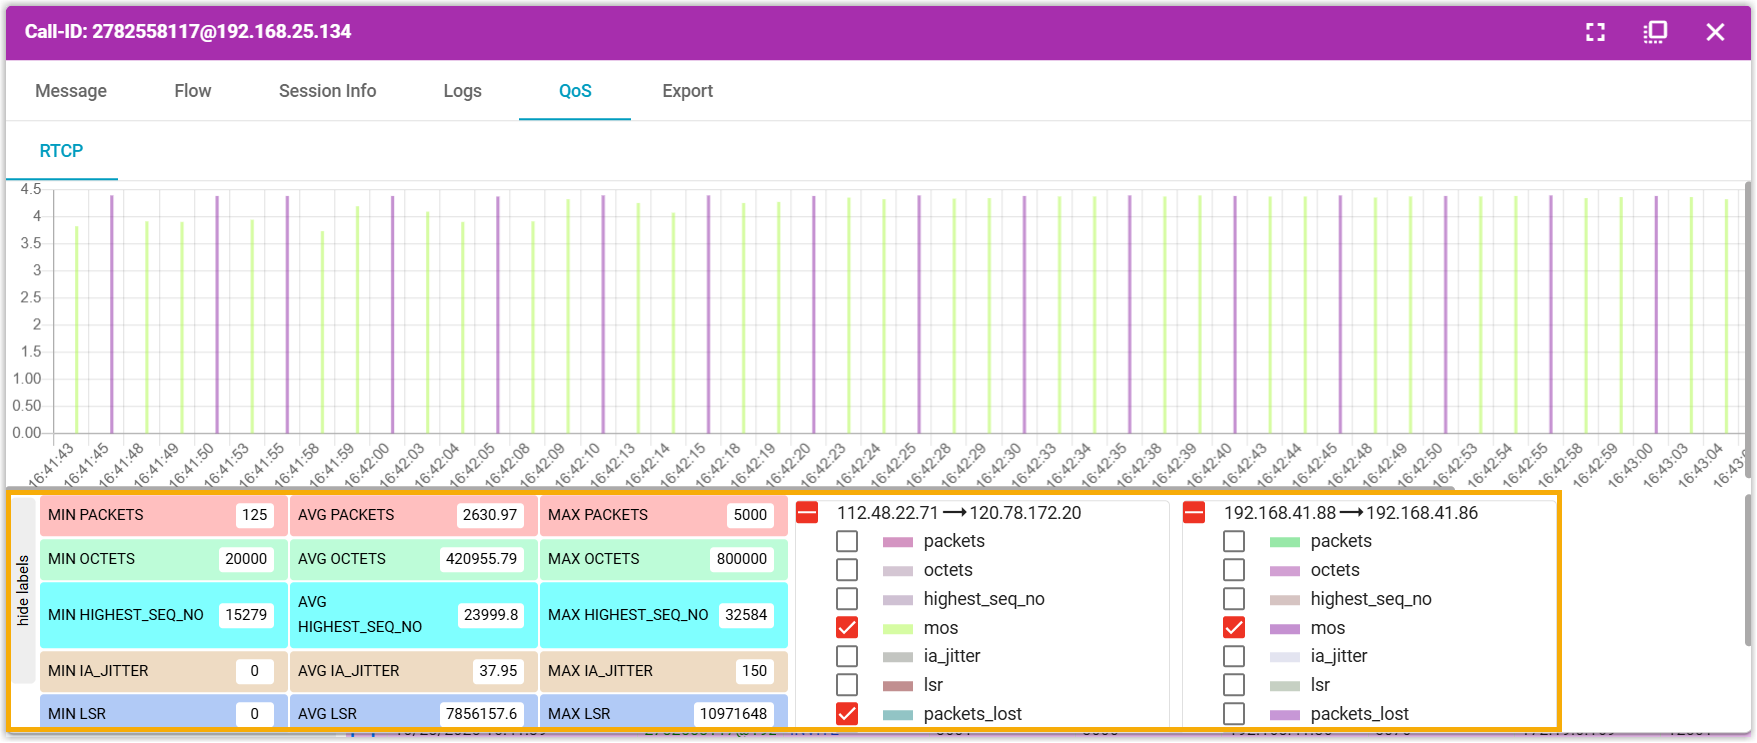
- To assess call quality, click the QoS
tab.
Quality metrics (including MOS score, packet loss, jitter, and more) derived from the underlying RTP/RTCP streams are displayed, providing immediate insight into the user experience.
- To examine SIP message details, click the specific message
in the Message or
Flow tab.
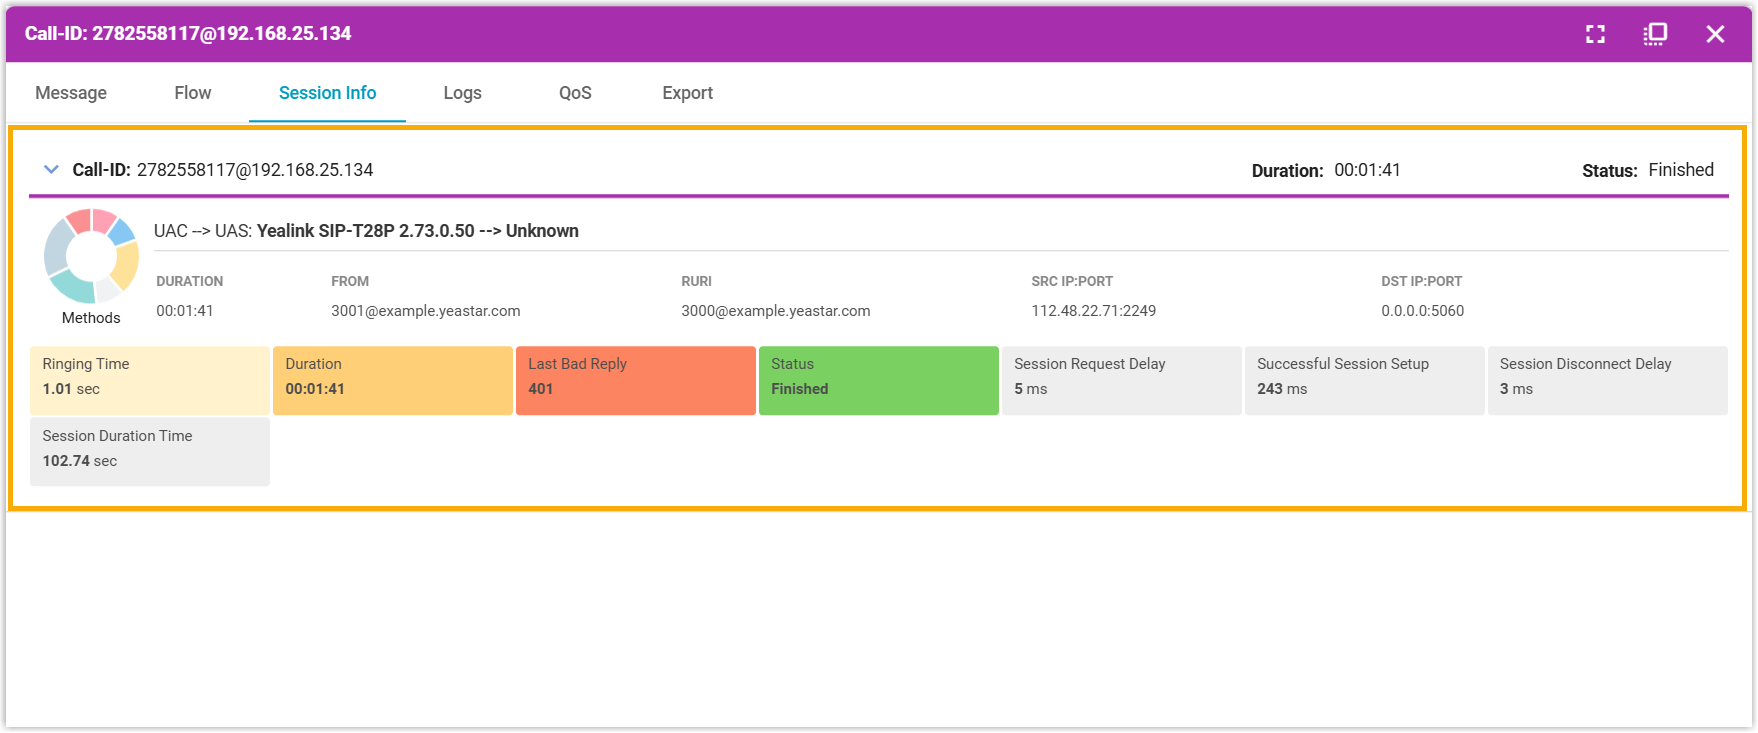
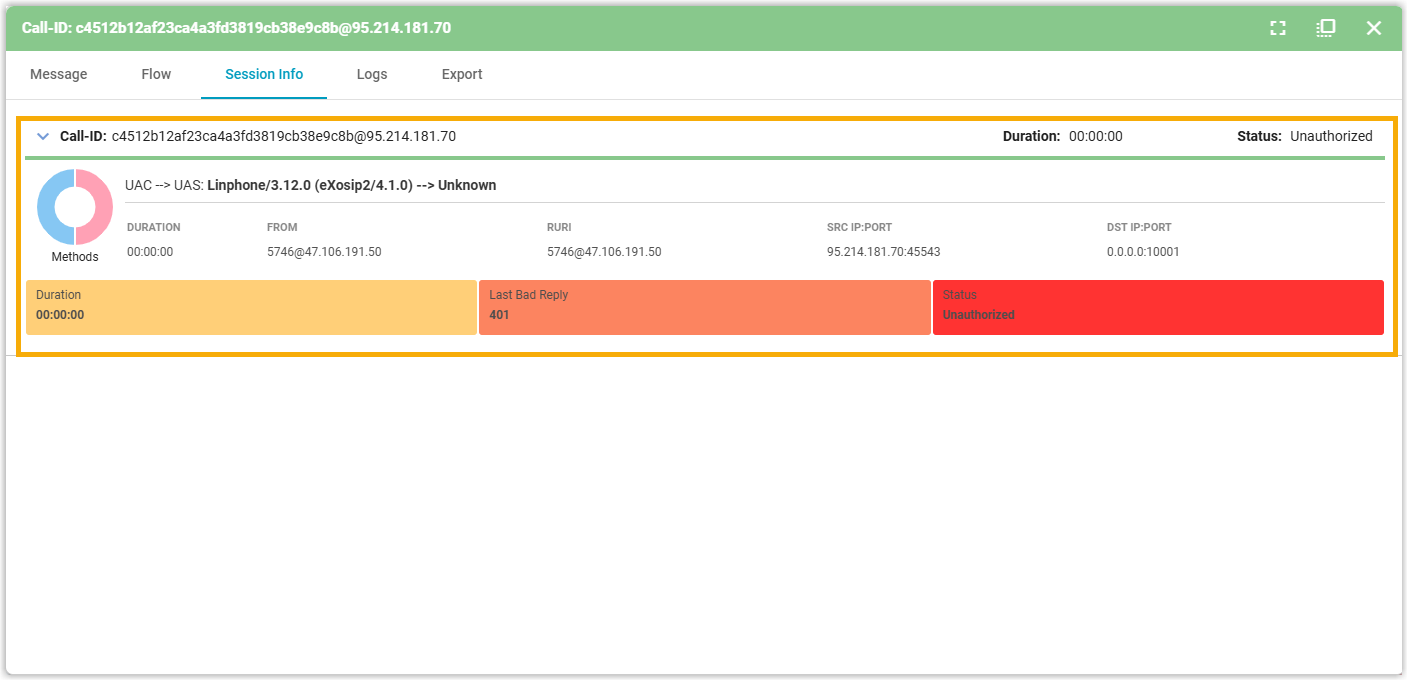
- To review session metadata, click the Session
Info tab.
A technical overview of the session is displayed, showing session parameters such as endpoints, timing information, and protocol details.
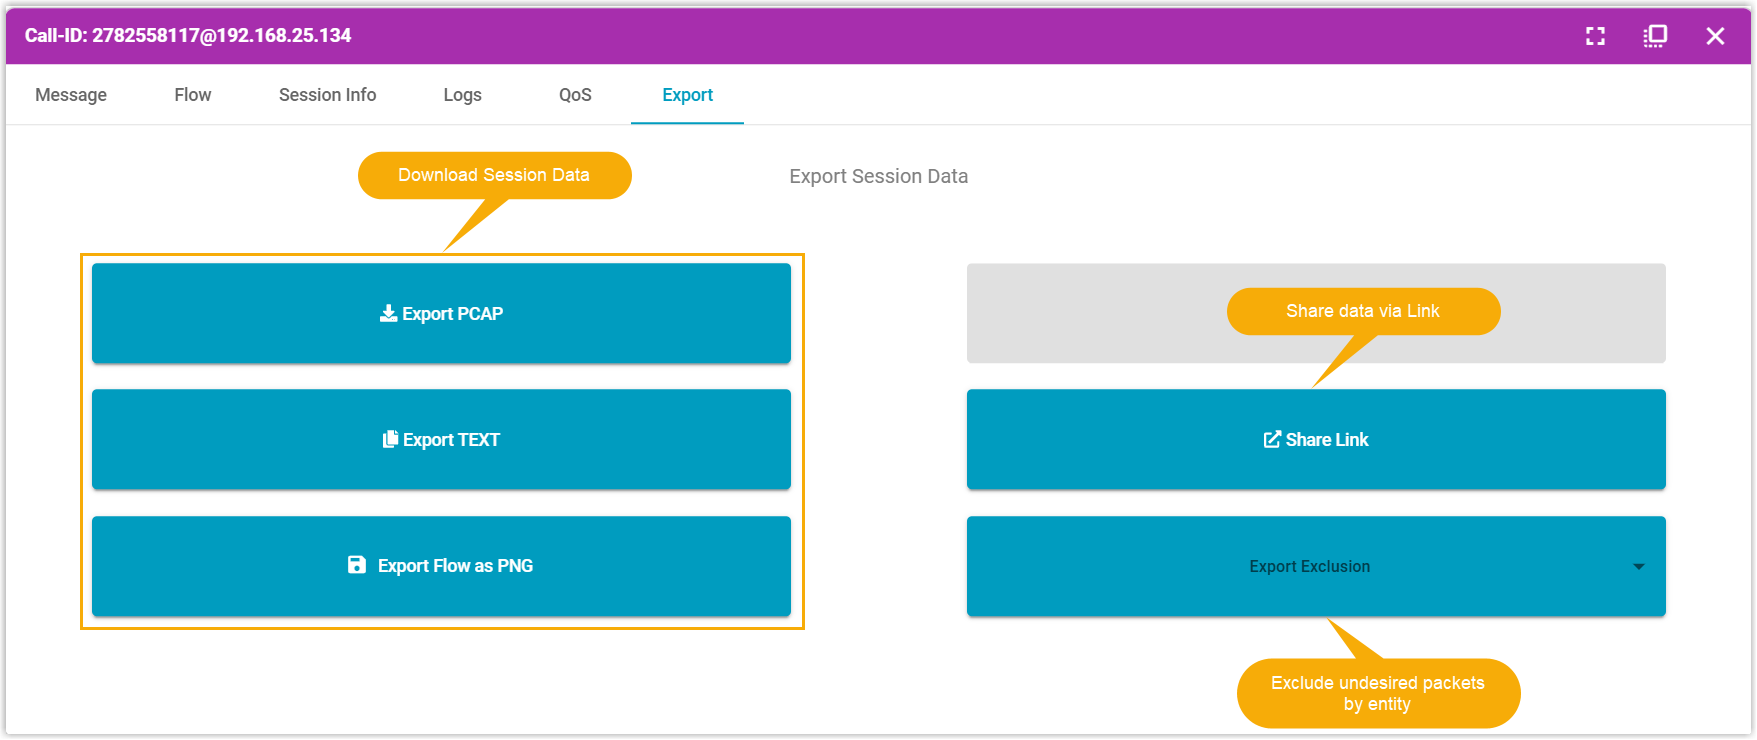
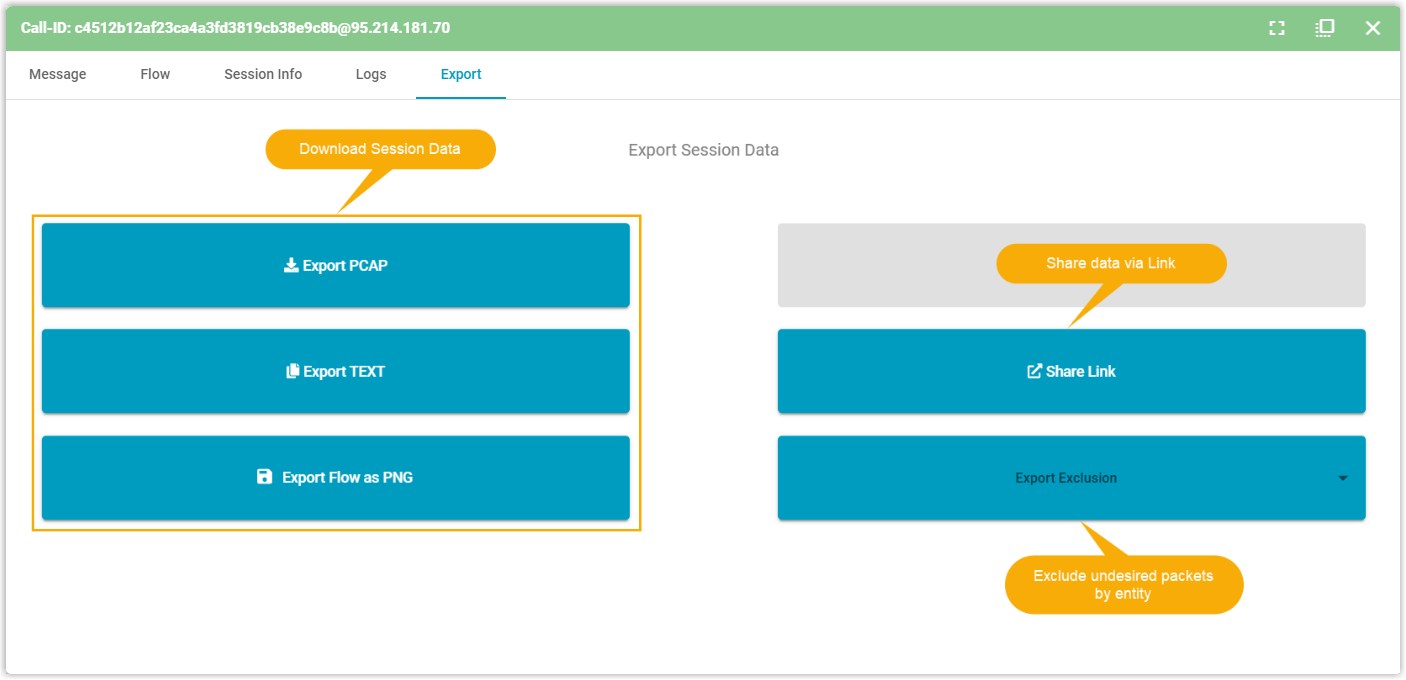
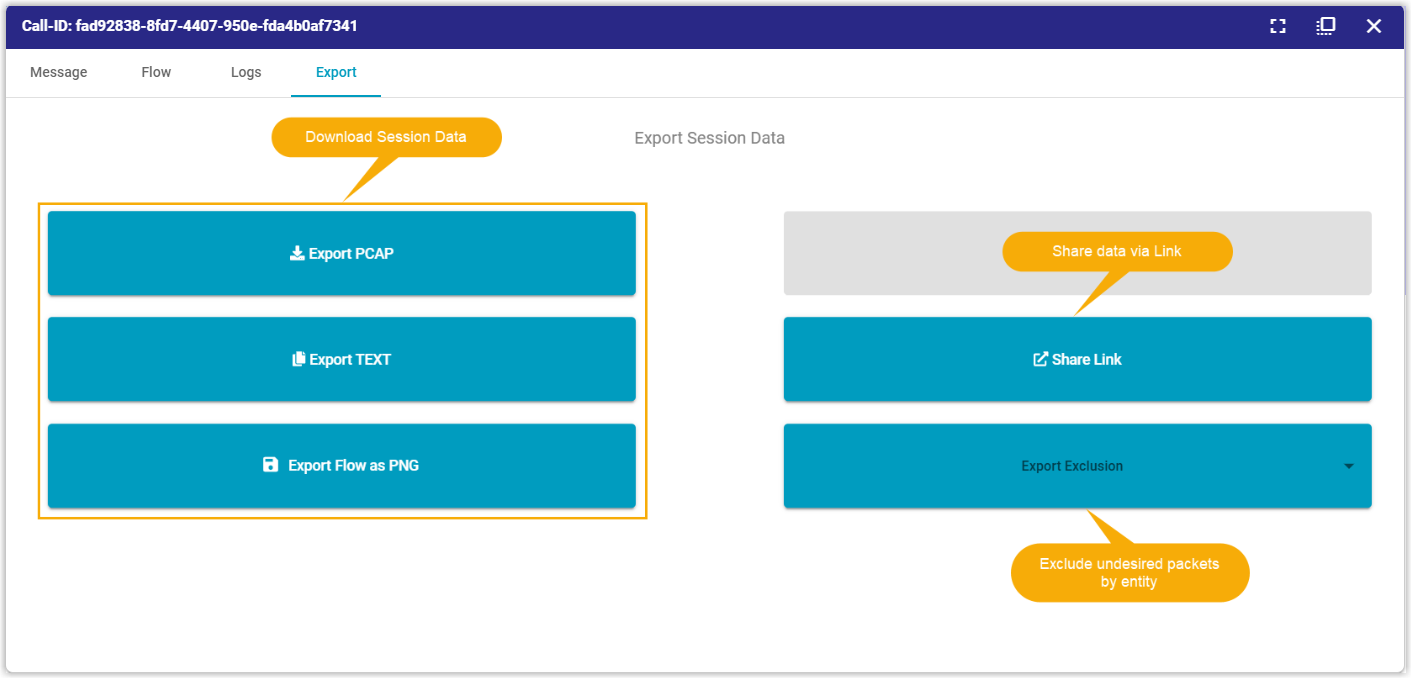
- To export the session details for further analysis, click the
Export tab, then select your preferred
format:Tip: Use Export Exclusion to filter out traffic from specified entities.
- Export PCAP: Download a packet capture file for packet-level analysis using external tools.
-
Export TEXT: Export session details in text format for a log-based review.
-
Export Flow as PNG: Export a visual representation of the call flow as a PNG image.
-
Share Link: Generate a sharable link for collaborative troubleshooting.
- In the list, click the session ID of a session to open its
details.
Inspect registration traffic
- In the left panel of the Homer dashboard, filter for the target
session.Note: The dashboard displays a maximum of 200 records per page, you can use precise search criteria to locate specific sessions.
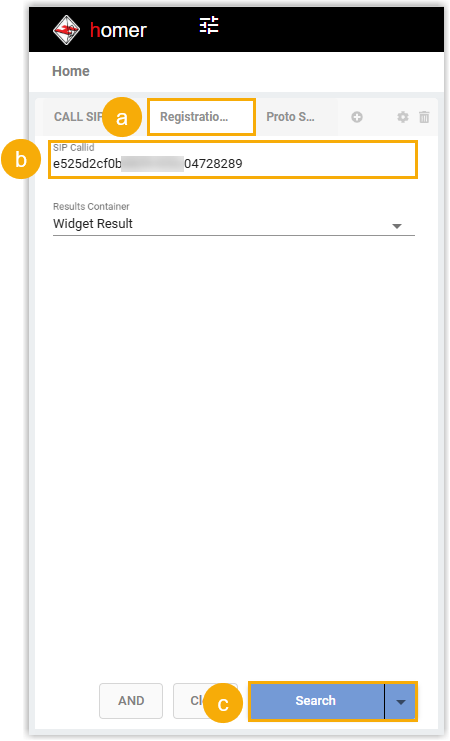
- Click the Registration SIP Search tab.
- Optional: In the SIP Callid field, enter the ID of the registration signaling session.
- Click Search.
- In the right panel of the Homer dashboard, check and analyze the desired
session.
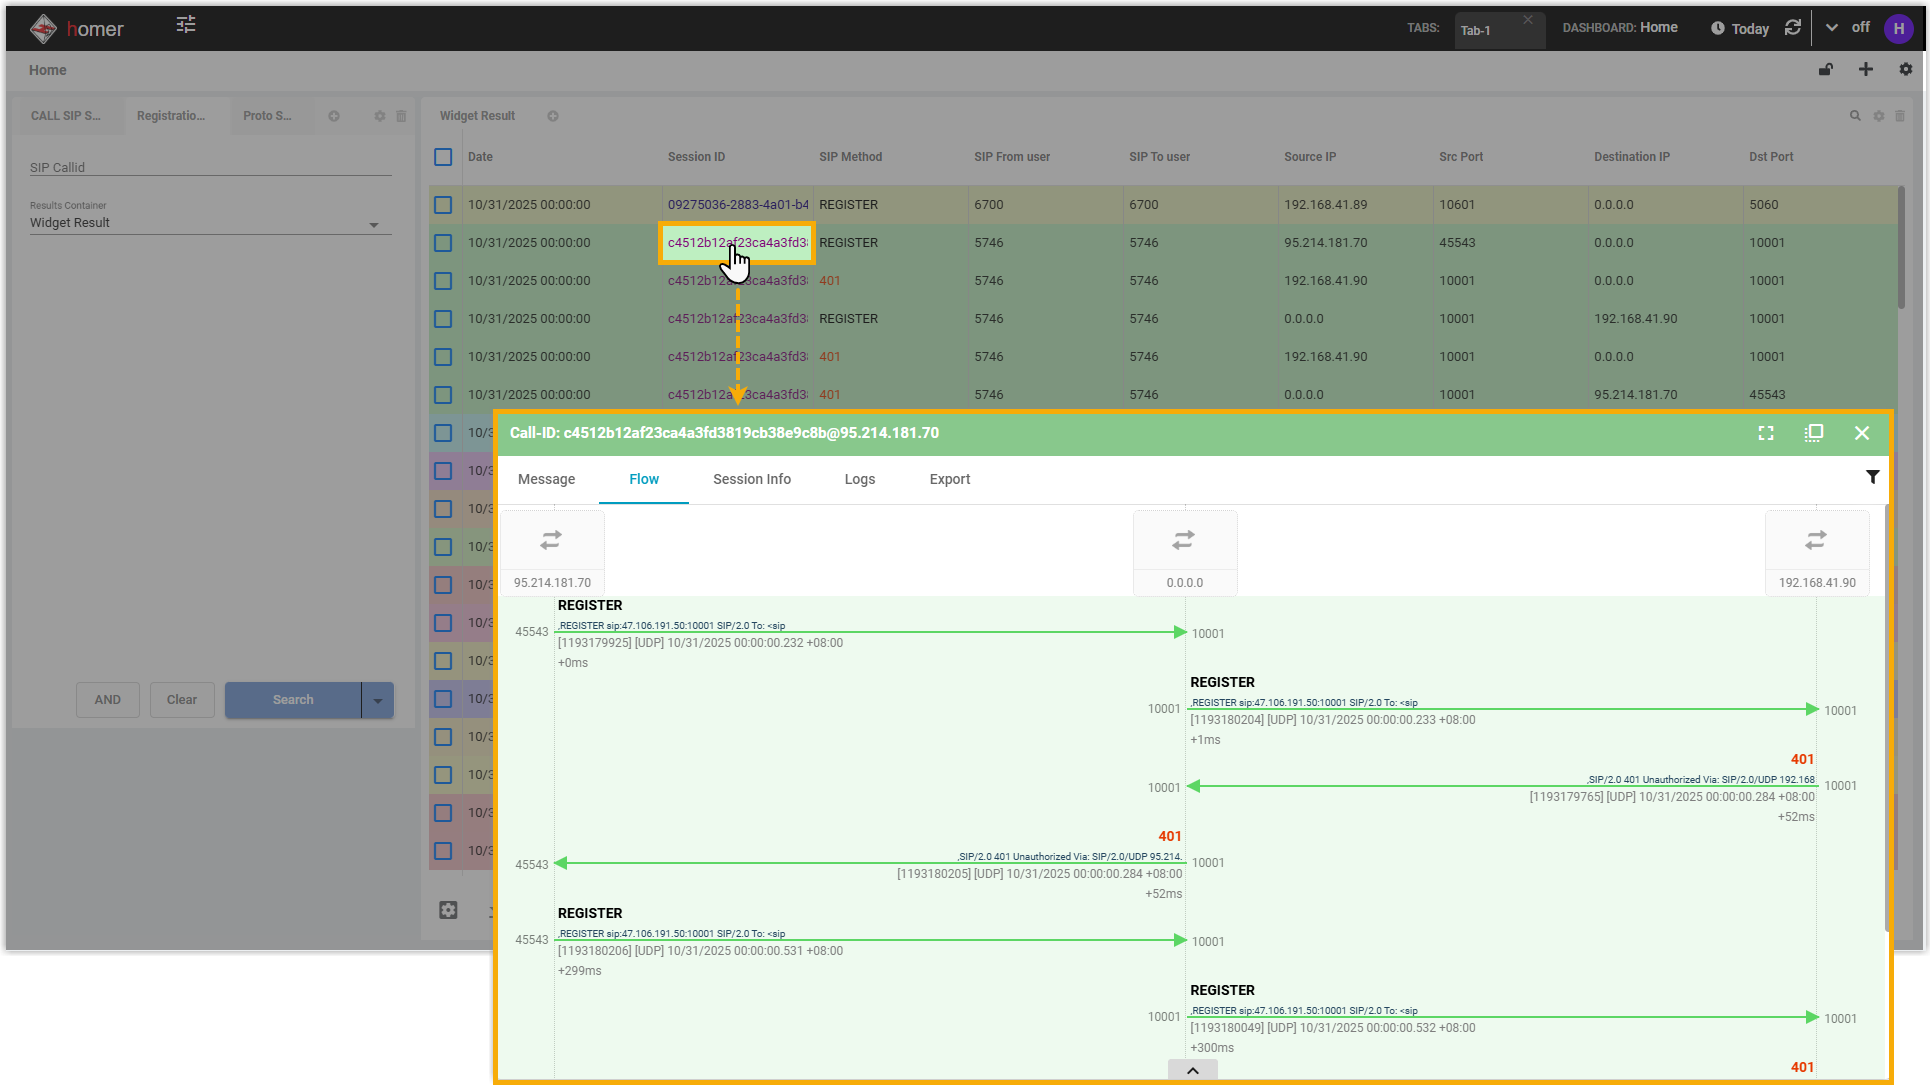
- In the list, click the session ID of a session to open the session
details.
A pop-up window appears, presenting a visual sequence diagram of the complete registration transaction for intuitive analysis.
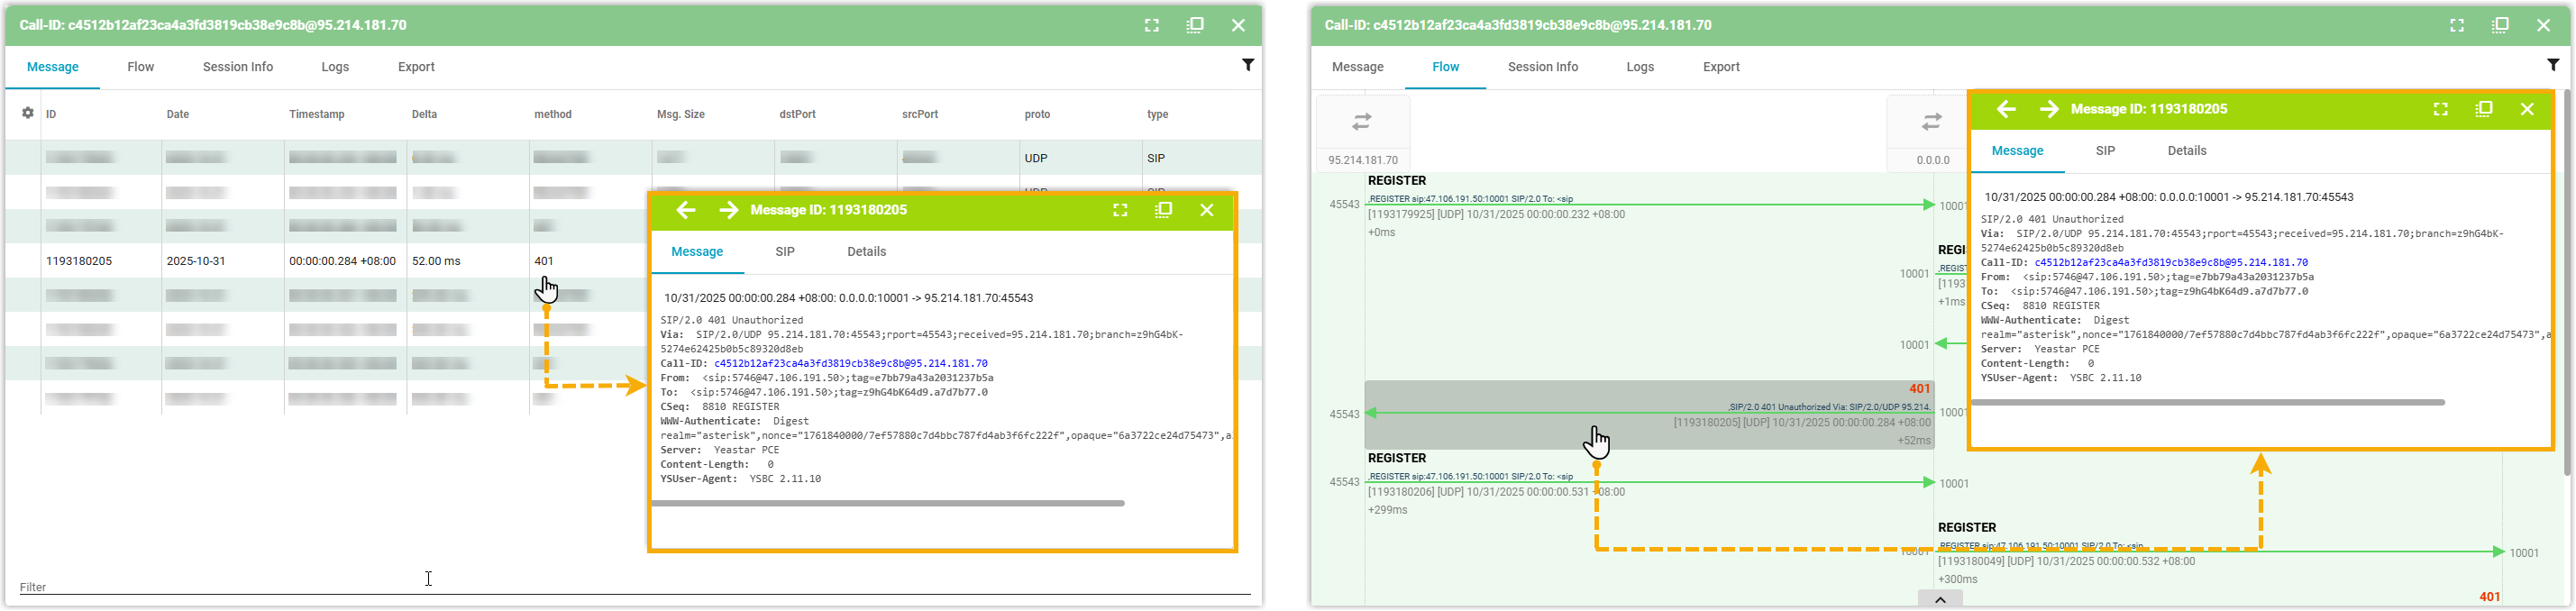
- To inspect the details of the registration transaction, click the
specific message in the Message or
Flow tab.
A details panel opens, displaying the complete headers and body content of the selected SIP message.
- To review session metadata, click the Session
Info tab.
A technical overview of the session parameters are displayed, including endpoints, timing information, and protocol details.
- To export the session details for further analysis, click the
Export tab, then select your preferred format:Tip: Use Export Exclusion to filter out traffic from specified entities.
- Export PCAP: Download a packet capture file for packet-level analysis using external tools.
-
Export TEXT: Export session details in text format for a log-based review.
-
Export Flow as PNG: Export a visual representation of the call flow as a PNG image.
-
Share Link: Generate a sharable link for collaborative troubleshooting.
- In the list, click the session ID of a session to open the session
details.
Investigate protocol messages
- In the left panel of the Homer dashboard, filter for the target session.Note: The dashboard displays a maximum of 200 records per page, you can use precise search criteria to locate specific sessions.
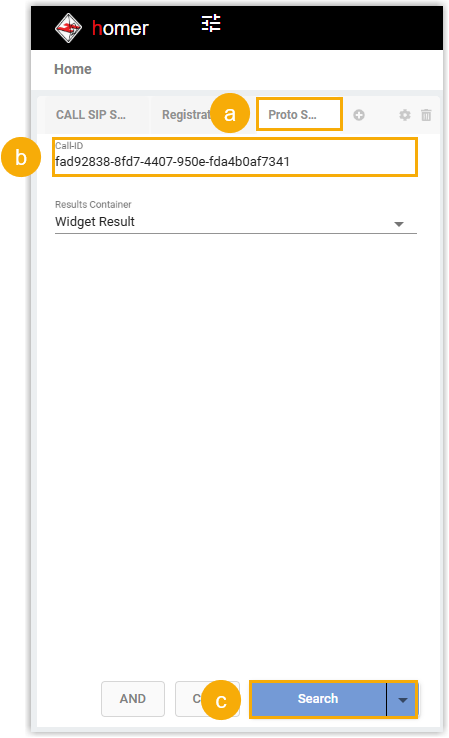
- Click the Proto Search tab.
- Optional: In the Call-ID field, enter the ID for the signaling session.
- Click Search.
- In the right panel of the Homer dashboard, check and analyze the desired
session.
- In the list, click the session ID to open the session details.
A pop-up window appears, presenting a visual sequence diagram of the complete transaction flow for intuitive analysis.
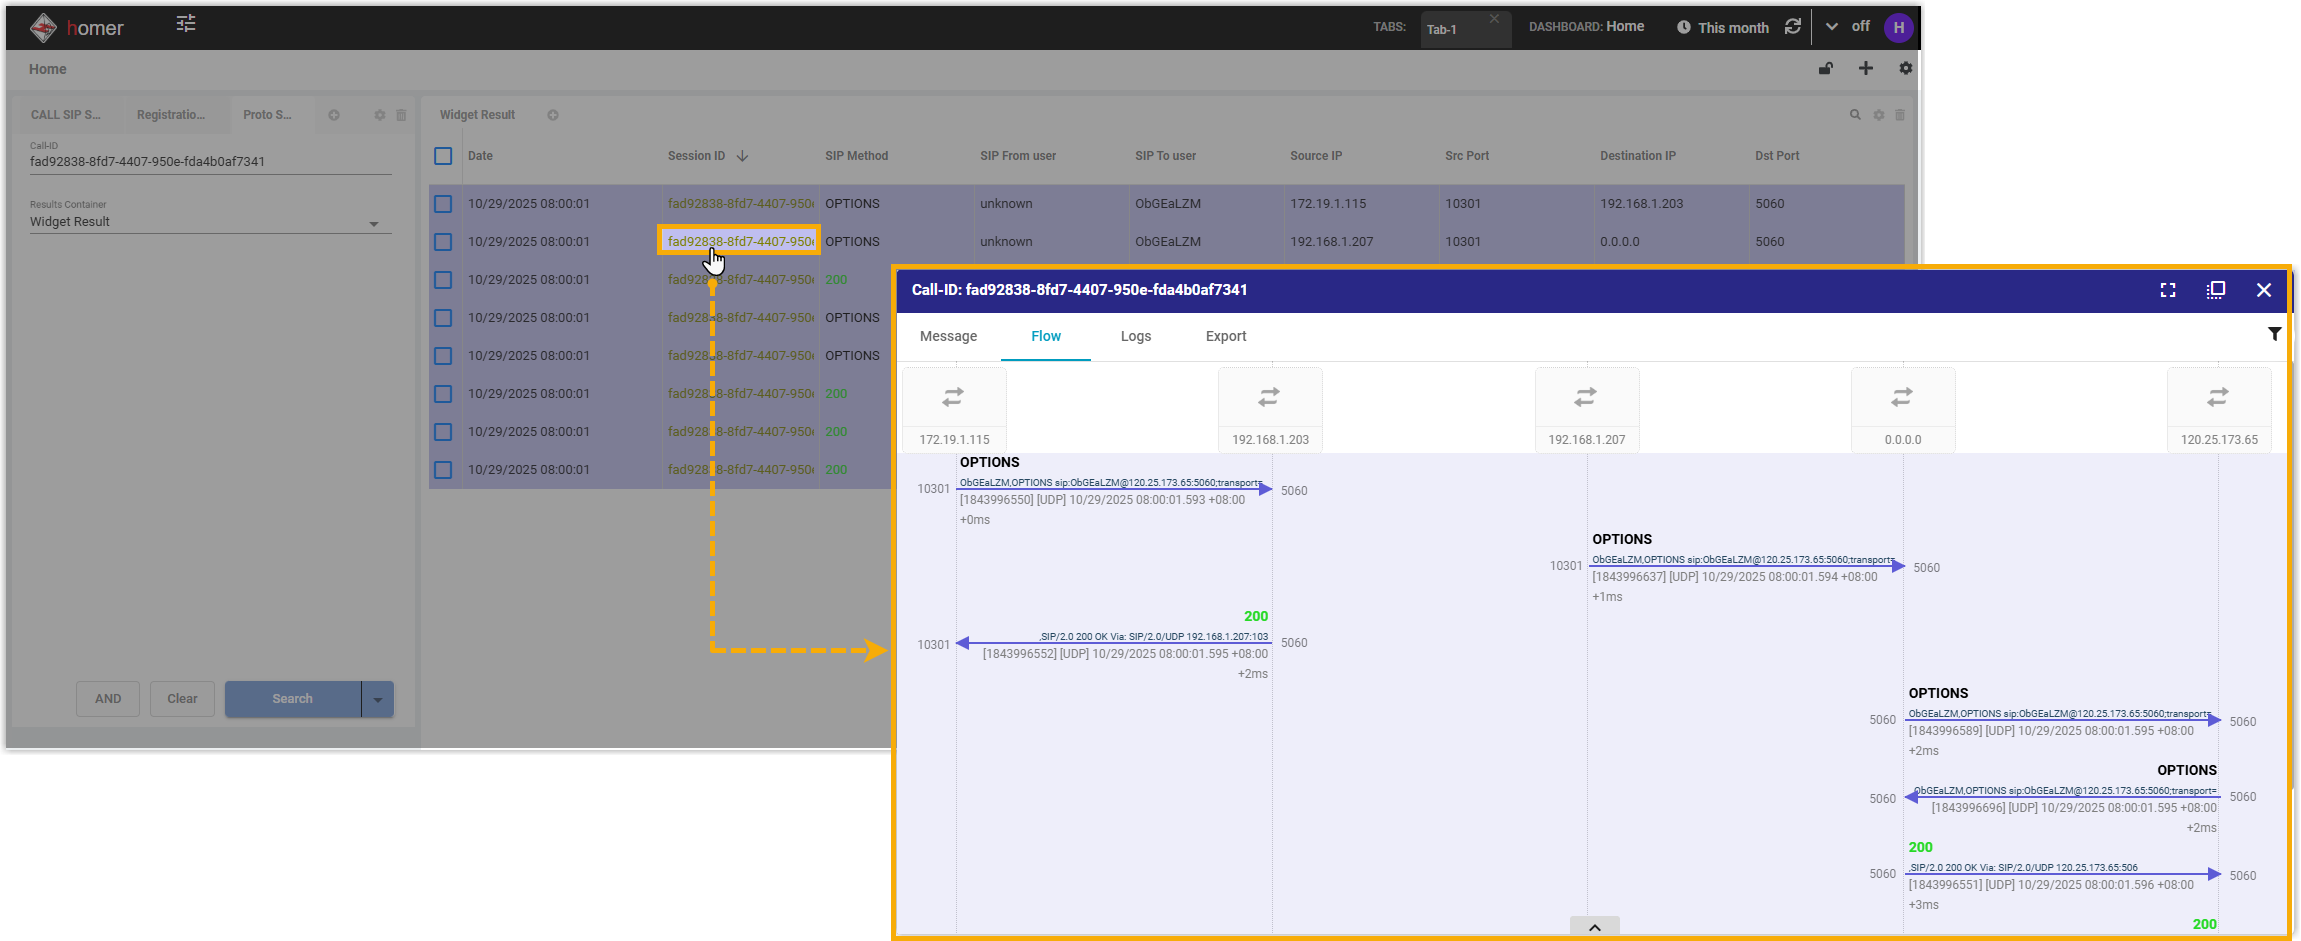
- To inspect the details of the SIP transaction, click the specific
message in the Message or
Flow tab.
A details panel opens, displaying the complete headers and body content of the selected SIP message.
- To export the session details for further analysis, click the
Export tab, then select your preferred format:Tip: Use Export Exclusion to filter out traffic from specified entities.
- Export PCAP: Download a packet capture file for packet-level analysis using external tools.
-
Export TEXT: Export session details in text format for a log-based review.
-
Export Flow as PNG: Export a visual representation of the call flow as a PNG image.
-
Share Link: Generate a sharable link for collaborative troubleshooting.
- In the list, click the session ID to open the session details.