Check Cluster Status
You can monitor the status of cluster servers on Yeastar Central Management, including SBC Cluster, SBC Proxy Cluster, and PBXHub Cluster.
Procedure
- Log in to Yeastar Central Management, go to .
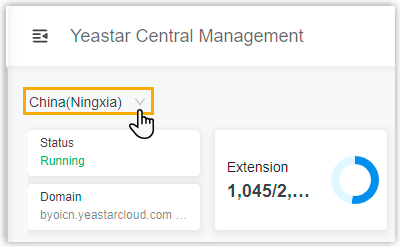
- At the top-left corner, select a region from the drop-down list.
- Check cluster status as needed.
Check system status and resources usage
At the top of Cluster Management page, check system status and resources usage in a desired region.
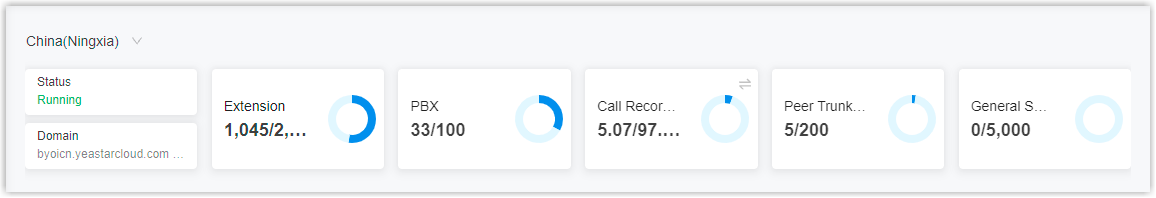
We provide a table to help you understand each metric.
| Metric | Description |
|---|---|
| Status |
|
| Domain | Display the wildcard domain of Cloud PBX and the associated IP address where the domain is forwarded. |
| PBX | The total, used, and available number of PBXs. Note:
|
| Extension | The total, used, and available number of extensions. Note:
|
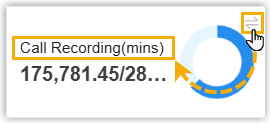
| Call Recording | The total, used, and available recording capacity. Note:
Tip: Click
|
| Peer Trunk Port | The total, used, and available number of ports for
Port-based Peer Trunk. Note:
|
| General Service Port | The total, used, and available number of ports for the
following services:
Note:
|
Check SBC Cluster status
SBC Server is the server that works as a security component of P-Series Cloud PBX. Data packet of the following services are transferred through the server:
- PBX web access
- Account trunk
- SIP extension registration
- Linkus clients login and registration
- Procedure
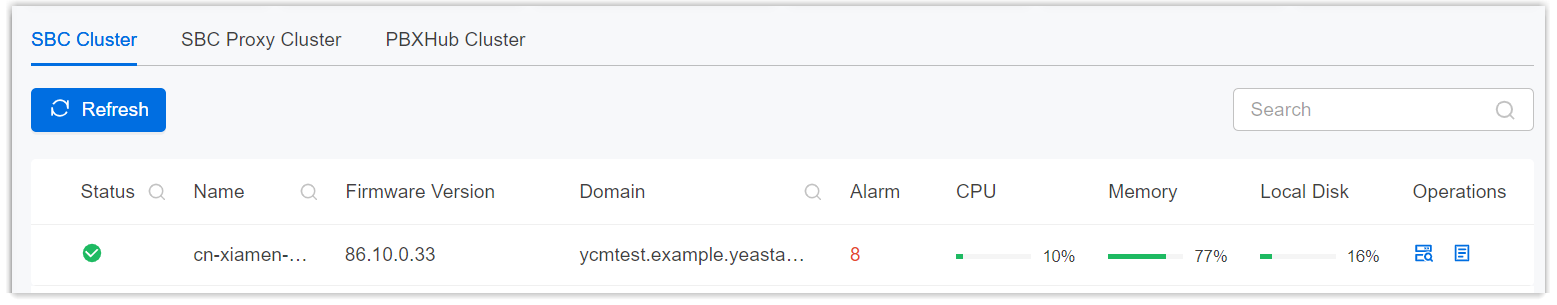
- Click SBC Cluster tab to check the status of SBC Server(s) in the region.
-
We provide a table to help you understand each metric.
Metric Description Status  : The SBC
Server is running.
: The SBC
Server is running. : The SBC
Server is stopped.
: The SBC
Server is stopped. : The SBC
Server is upgrading.
: The SBC
Server is upgrading. : The SBC
Server is starting.
: The SBC
Server is starting.
Name The name that helps you identify the SBC Server. Firmware Version The current firmware version of the SBC Server. Domain The wildcard domain of Cloud PBX that you have forwarded to the SBC Server. Alarm Alarms on the SBC Server. Tip: To check the alarm(s), click the number, then you will be redirected to the Alarm page.CPU The CPU usage of the SBC Server. Memory The memory usage of the SBC Server. Local Disk The local disk usage of the SBC Server. Operations  (Monitor):
Check the metrics and trends for the monitored
system performance (including server load,
resource utilization, network traffic) of the SBC
Server.
(Monitor):
Check the metrics and trends for the monitored
system performance (including server load,
resource utilization, network traffic) of the SBC
Server.For more information, see Check Cluster Server System Performance.
 (Detail): Check the
server
information and network information of the SBC
Server.
(Detail): Check the
server
information and network information of the SBC
Server.
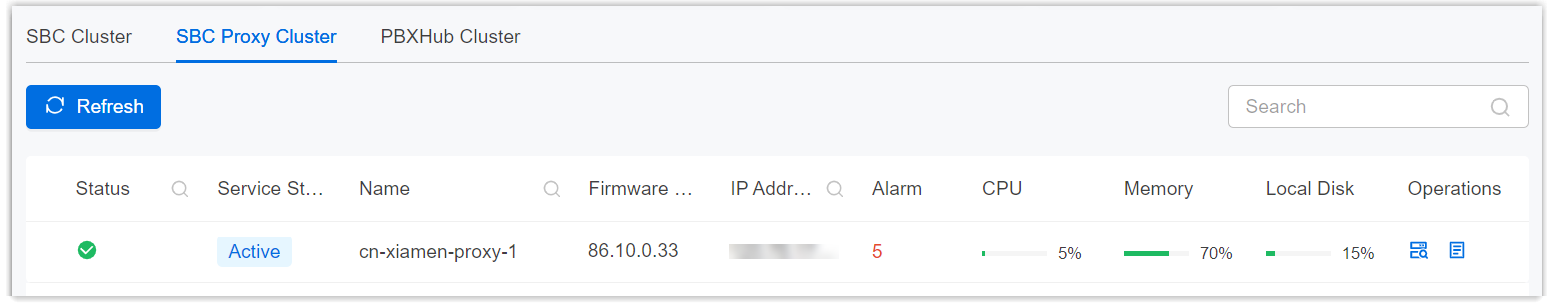
Check SBC Proxy Cluster status
- Register Trunk
- Port-based Peer Trunk
- DID-based Peer Trunk
- Service port assignment, including ports for SSH connection, AMI integration, and database grant.
- Procedure
- Click SBC Proxy Cluster tab to check the status of SBC Proxy Server(s) in the region.
-
We provide a table to help you understand each metric.
Metric Description Status - : The SBC Proxy
Server is working.
- : The SBC Proxy Server is
stopped.
- : The SBC Proxy Server is
upgrading.
- : The SBC Proxy
Server is starting.
Service Status - Active: The SBC Proxy Server is in service.
- Standby: The SBC Proxy Server works as the standby server. It monitors the active SBC Proxy Server and is always ready for taking over once the active server goes down.
Name The name that helps you identify the SBC Proxy Server. Firmware Version The current firmware version of the SBC Proxy Server. IP Address The public IP address of the SBC Proxy Server. Alarm Alarms on the SBC Proxy Server. Tip: To check the alarm(s), click the number, then you will be redirected to the Alarm page.CPU The CPU usage of SBC Proxy Server. Memory The memory usage of SBC Proxy Server. Local Disk The local disk usage of SBC Proxy Server. Operations - (Monitor):
Check the metrics and trends for the monitored
system performance (including server load,
resources utilization, network traffic) of the SBC
Proxy Server.
For more information, see Check Cluster Server System Performance.
- (Detail): Check the
server information and network information of the
SBC Proxy Server, as well as the usage of ports
(ports for Port-based Peer Trunk, SSH connection,
AMI integration, and database grant).
Check PBXHub Cluster status
- PBX instance launching
- Storage for the followings:
- System data of PBXHub Server
- System data and recording files of Cloud PBX instances
- Port assignment for Peer Trunk (Private Network)
- Procedure
-
Click PBXHub Cluster tab to check the status of PBXHub Server(s) in the region.
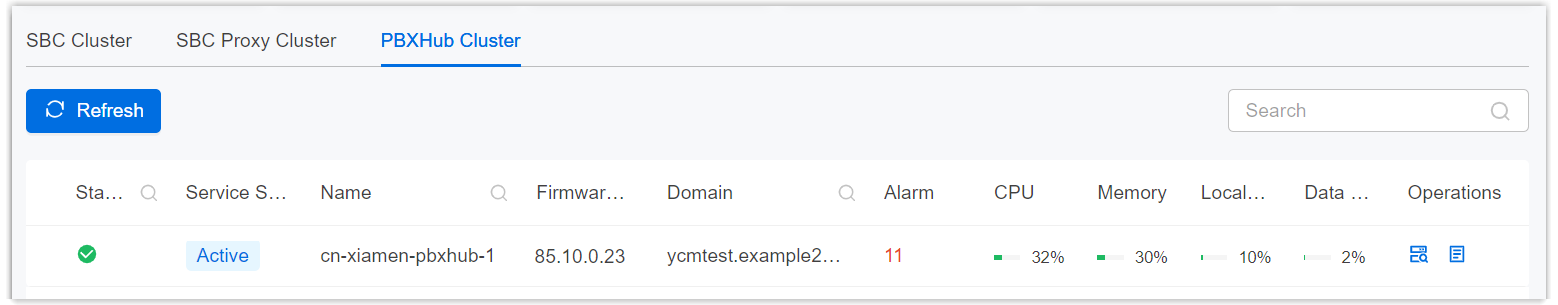
We provide a table to help you understand each metric.
Metric Description Status - : The PBXHub
Server is working.
- : The PBXHub Server is
stopped.
- : The PBXHub Server is
upgrading.
- : The PBXHub
Server is starting.
Service Status - Active: The PBXHub Server is in service.
- Standby: The PBXHub Server works as the standby server. It monitors the active PBXHub Server and is always ready for taking over once the active server goes down.
Name The name that helps you identify the PBXHub Server. Firmware Version The current firmware version of the PBXHub Server. Domain The wildcard domain of Cloud PBXs that are created in the PBXHub Server. Alarm Alarms on the PBXHub Server. Tip: To check the alarm(s), click the number, then you will be redirected to the Alarm page.CPU The CPU usage of the PBXHub Server. Memory The memory usage of the PBXHub Server. Local Disk The local disk usage of the PBXHub Server. Note: The disk is used to store system data for the PBXHub Server.Data Disk The data disk usage of the PBXHub Server.Note: The disk is used to store the system data and recording files of Cloud PBXs that are created in PBXHub Cluster.Operations - (Monitor):
Check the metrics and trends for the monitored
system performance (including server load,
resources utilization, network traffic) of the
PBXHub Server.
For more information, see Check Cluster Server System Performance.
- (Detail): Check the
server information and network information of the
PBXHub Server, as well as the usage of PBX
resources.