Check Cluster Server System Performance
You can monitor the system performance (including server load, resources utilization, and network traffic) of cluster servers (SBC Server, SBC Proxy Server, and PBXHub Server) on Yeastar Central Management. This topic describes how to check the monitored system performance, and explains the metrics in detail.
Procedure
- Log in to Yeastar Central Management, go to .
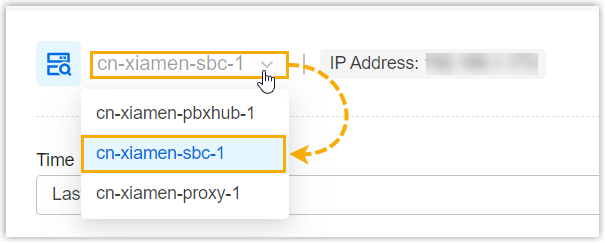
- At the top-left corner of the page, select the desired cluster
server.
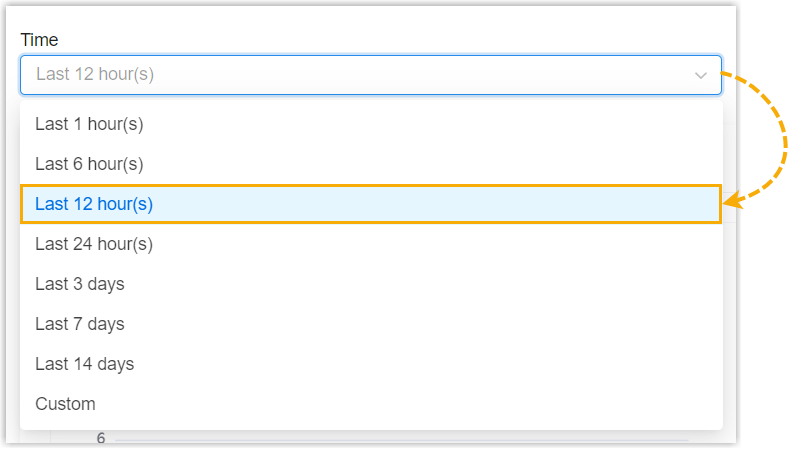
- In the Time drop-down list, select or customize a
time frame to filter the data.Note:
- You can query data within a maximum time frame of 30 days.
- By default, the maximum storage time for the monitoring data is 30 days, and the maximum storage capacity is 10 GB. When either of these thresholds is reached, the oldest data will be overwritten directly. Storing the monitoring data for 30 days takes up approximately 600 MB of storage space. If you require longer data retention, contact Yeastar for expansion.
- Check the metrics and trends of the following system performance according
to your needs.Tip:
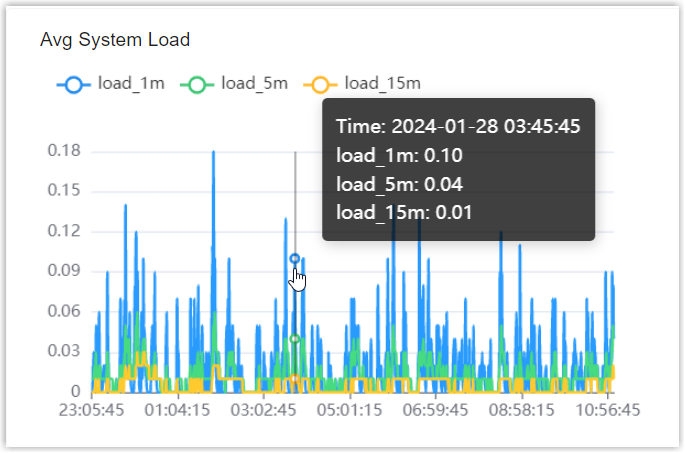
- To check the details of a metric on a specific time point, hover
your mouse over the trend line.
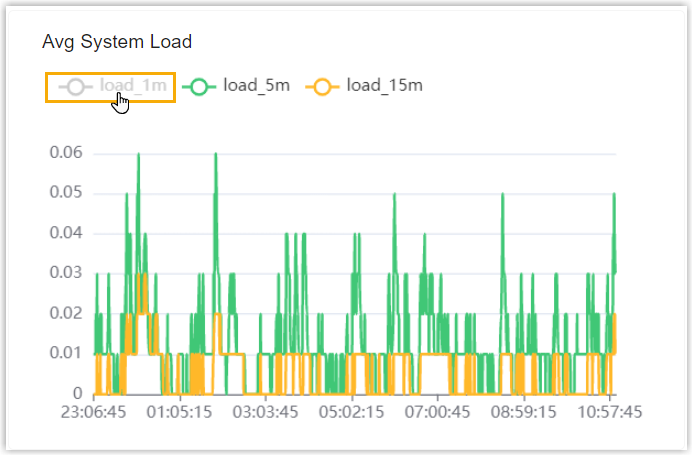
- To focus on the trend line of specific metrics, deselect the
unwanted metrics at the top-left of the monitoring view.
- To view more granular details, click
 and drag the portion of the
visualization that you want to magnify; To revert to a previous
zooming operation, click
and drag the portion of the
visualization that you want to magnify; To revert to a previous
zooming operation, click  .
.
- To check the details of a metric on a specific time point, hover
your mouse over the trend line.
Check resource utilization of CPU and memory, and server load
In the CPU, Memory, and Load Metrics section, check the resource utilization and load of the server.
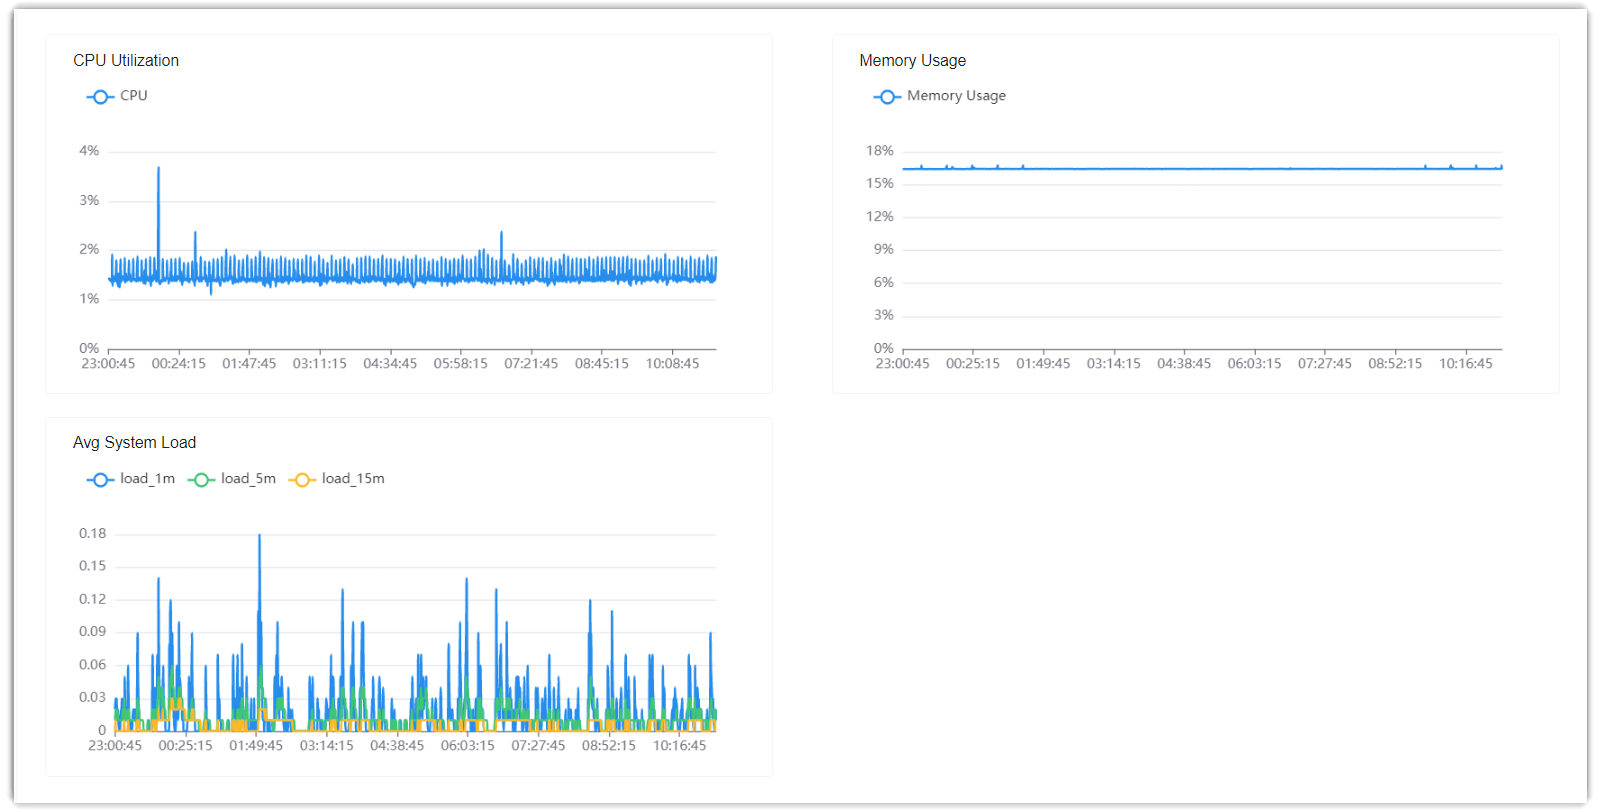
We provide a table to help you understand each metric.
| Metric | Description |
|---|---|
| CPU Utilization | The percentage of the CPU capacity that is currently in use. |
| Memory Usage | The percentage of the memory that is currently in use. |
| Avg System Load | The average system load on the server over a specific period
of time. Sub-metrics:
Note: If the values
of the sub-metrics are close to each other, it indicates
that the system load is stable. |
Check statistics of local disk, data disk, and recording disk
In the Disk Metrics section, select the desired disk from the Disk Device drop-down list, then check the corresponding disk statistics.
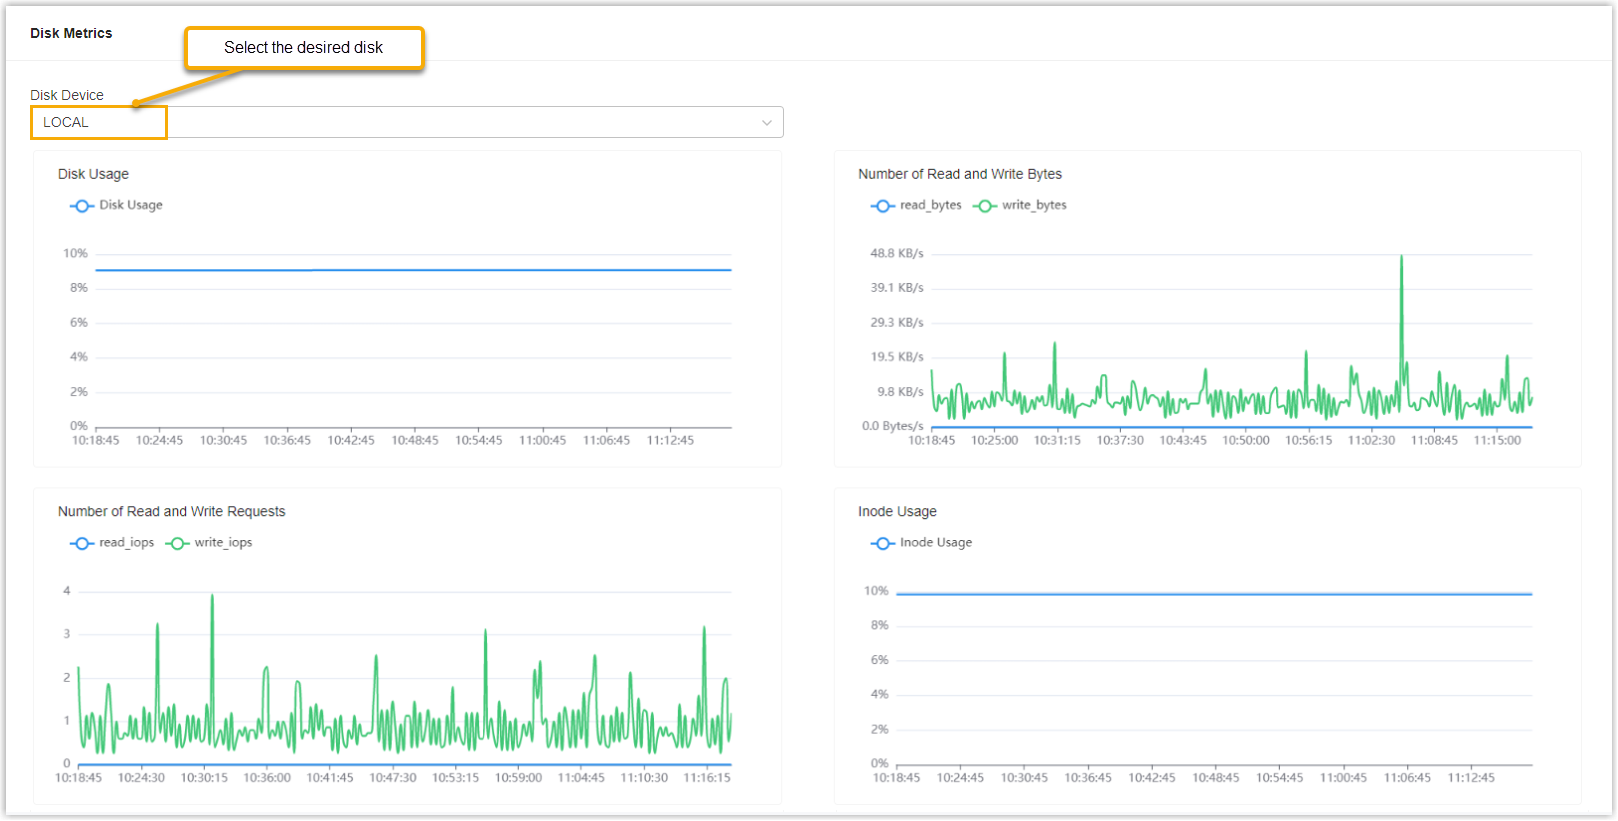
We provide a table to help you understand each metric.
| Metric | Description |
|---|---|
| Disk Usage | The percentage of disk space that is currently in use. |
| Number of Read and Write Bytes | The number of bytes read/written by the disk per
second. Sub-metrics:
Note: This metric
helps to determine whether there are potential load issues in
the server. Abnormal read and write byte values indicate that
there might be issues such as disk failures, hardware damage,
configuration errors, etc. |
| Number of Read and Write Requests | The number of read/write requests per
second. Sub-metrics:
Note: This metric helps to
determine whether there are potential load issues in the server.
Large read and write requests usually indicate that the server
is performing frequent read and write operations, which could
lead to increased disk activity and latency. |
| Inode Usage | The percentage of the inode that is currently in use. Note: The number of inodes
represents the number of files in a file system. A large number
of small files could lead to a high inode usage rate. If the
disk space is not full, but all the inodes have been allocated,
this could result in a situation where new files cannot be
created on the disk. |
Check network traffic of a network interface
In the Network Metrics section, select the desired network interface from the Network Device drop-down list, then check the corresponding network traffic data.
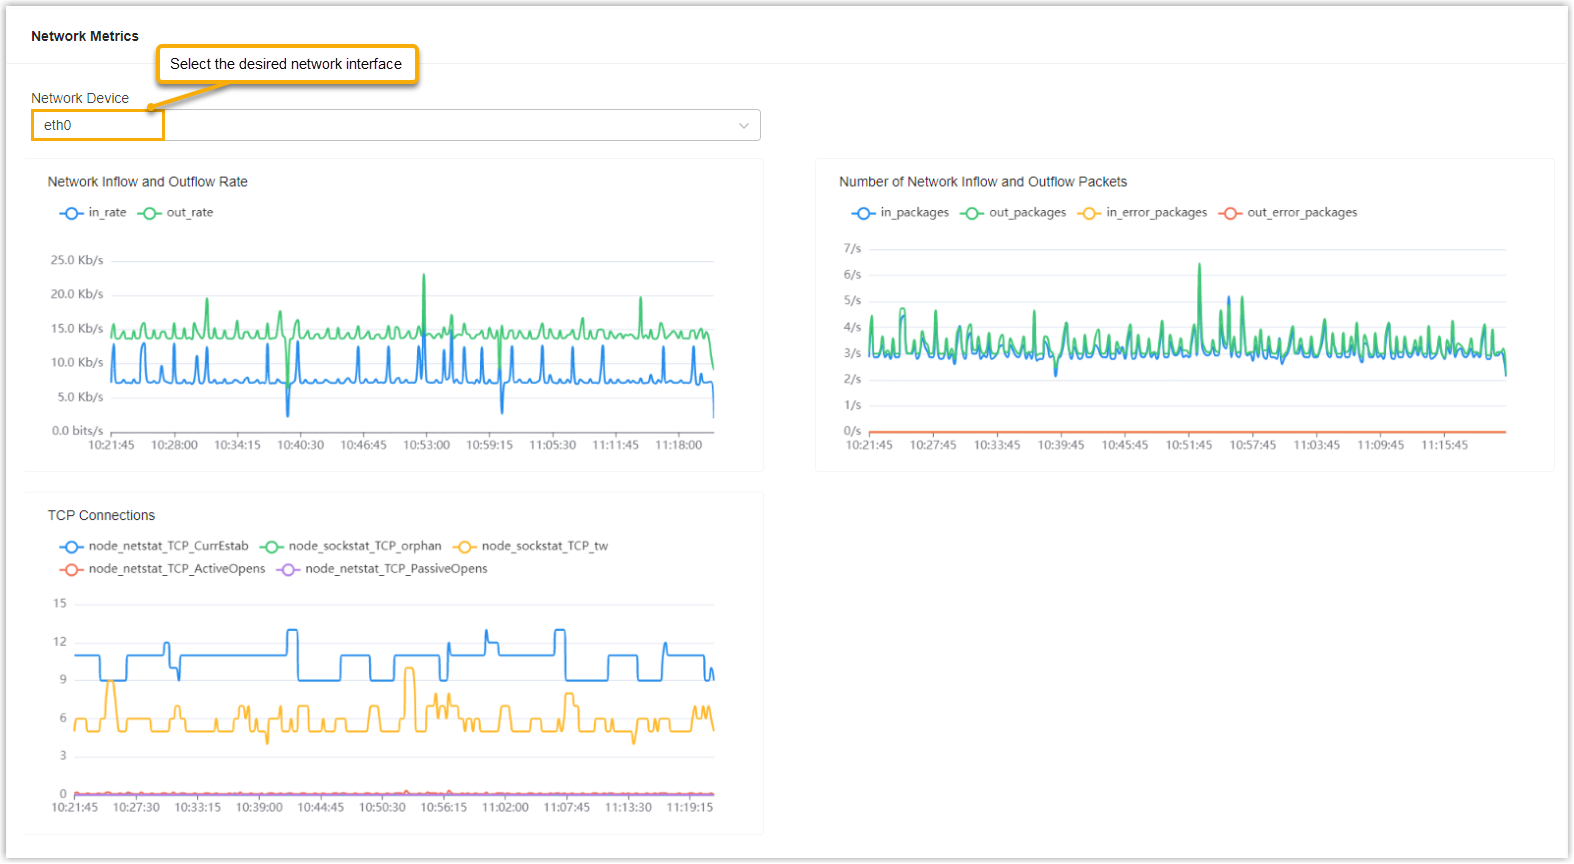
We provide a table to help you understand each metric.
| Metric | Description |
|---|---|
| Network Inflow and Outflow Rate | The number of bits received or sent over the network
interface. Note: This metric helps to
determine whether a large amount of bandwidth resources are
being used, and to identify issues such as link
congestion. Sub-metrics:
|
| Number of Network Inflow and Outflow Packets | The number of packets received or sent over the network
interface. Note: This metric helps to
determine if there are any issues within the network.
Excessive error packets indicate that there might be issues
such as network interface failures, network congestion, or
network attacks. Sub-metrics:
|
| TCP Connections | The number of TCP connections. Note: This metric helps to determine
whether there are any network congestion issues.
Sub-metrics:
|