View Queue Statistics on Wallboard
As a manager of a queue or multiple queues, you can view the queue related statistics to measure the queue performance. This topic describes how to view queue related statistics.
Requirements
- PBX server: 84.19.0.70 or later
- Linkus Desktop Client: 1.13.3 or later
Prerequisites
- You are a queue manager, or an agent with wallboard access permission assigned.
- You have the permission to access Linkus Web Client or Linkus Desktop Client.
- You have get username and password as well as the server's network information (domain name or IP addresses and ports) from your system administrator.
Step 1. Access Wallboard from Linkus UC Clients
You can access Wallboard from Linkus Web Client or Desktop Client.
- Log in to Linkus UC Clients.
- Log in to Linkus Web Client
-
Tip: If you have received a Linkus welcome email, you can click the login link for Linkus Web Client to quickly log in.
- Launch your web browser, enter thedomain of Linkus Web Client, press Enter.
- Enter your username and password, then click
LOG IN.
- Username: Extension number or email address.
- Password: Extension User Password.
- Log in to Linkus Desktop Client
-
Tip: If you have received a Linkus welcome email, you can use the login link to quickly log in to Linkus Desktop Client.
- Open Linkus Desktop Client.
- Enter the login information, then click LOG
IN.
- Username: Extension number or email address.
- Password: Extension User Password.
- Domain: Enter the domain
name or click
 to
enter the IP addresses and ports.
to
enter the IP addresses and ports.
- Go to .
Step 2. Filter queue statistics
Click on the links below to check how to filter queue statistics in each view:
- Wallboard view for queue call metrics
- Wallboard view for queue call metrics provides a comprehensive display of aggregated data of all queues as well as individual queue metrics. You can choose to view the statistics of all queues or a single queue.
-
- At the top-left corner of Wallboard, select the
desired queue.

- At the top-right corner of Wallboard, select the time range of
statistics to display.

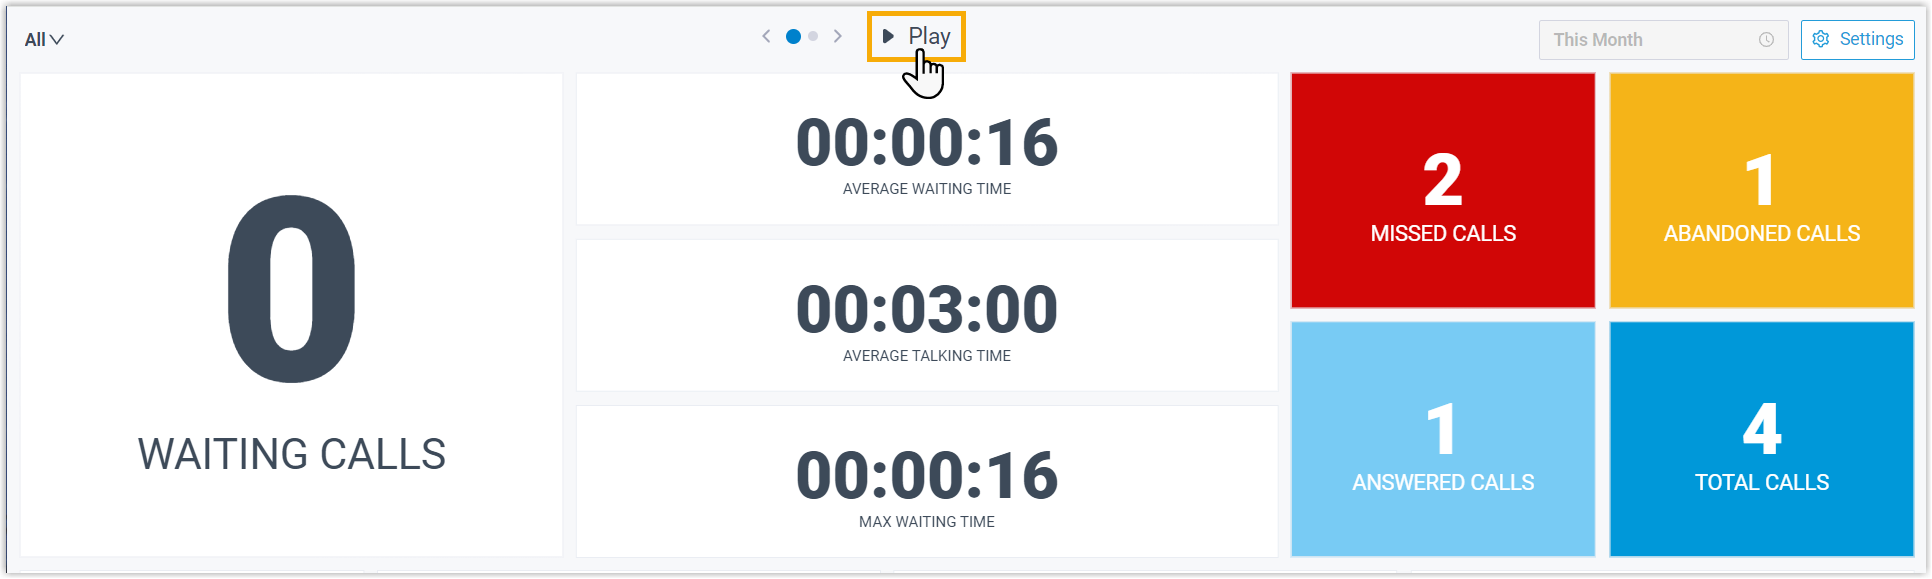
The call statistics for all queues or a single queue within the specified time range are displayed.
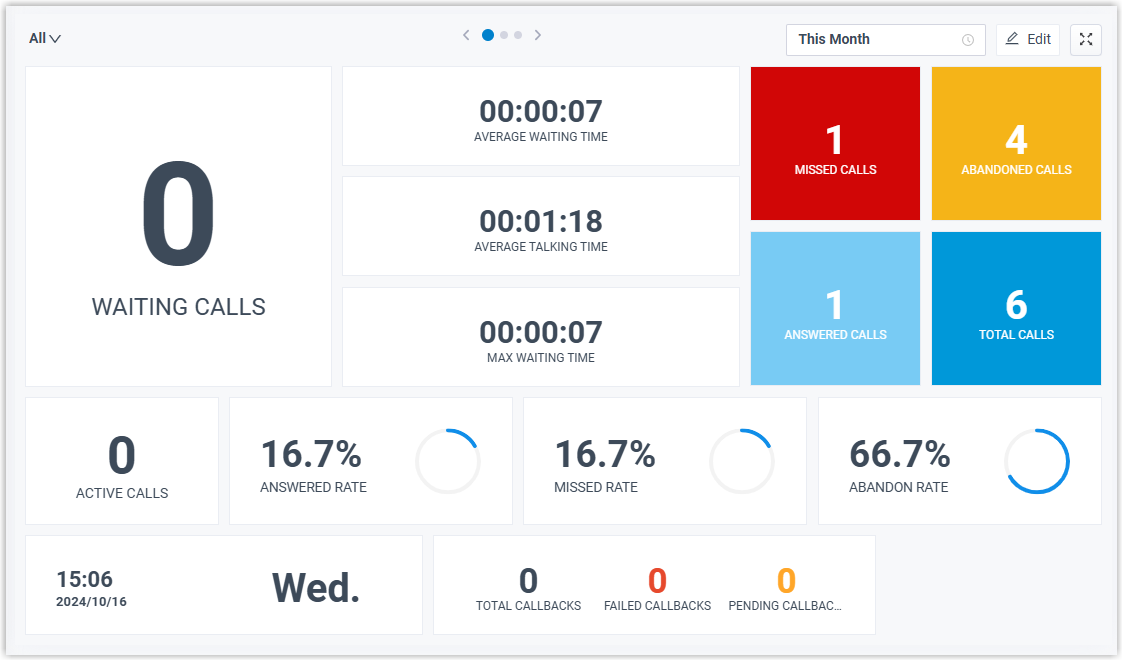
To understand each metric, you can refer to the table below.
Widget Description DATE & TIME Display the date and time of the PBX. AVERAGE WAITING TIME Display the average call waiting time for queue calls answered over a period of time. AVERAGE TALKING TIME Display the average amount of time that an agent spends talking to a customer. MAX WAITING TIME Display the maximum call waiting time for all calls answered over a period of time. WAITING CALLS Display the number of waiting calls in the queue. ACTIVE CALLS Display the number of current active calls in the queue. ANSWERED CALLS Display the total calls that queue answered over a period of time. TOTAL CALLS Display the total calls that queue received over a period of time. MISSED CALLS Display the total calls that queue missed over a period of time. Tip: You can click on the widget to view the related queue call logs and manage processing status of these call logs. Any other agents who are authorized to view the queue's call logs can see the changes you make on their Linkus clients.ABANDONED CALLS Display the total calls that have been abandoned over a period of time. Tip: You can click on the widget to view the related queue call logs and manage processing status of these call logs. Any other agents who are authorized to view the queue's call logs can see the changes you make on their Linkus clients.ANSWERED RATE Display the answered rate over a period of time for all calls to the queue. MISSED RATE Display the missed rate over a period of time for all calls to the queue. ABANDON RATE Display the abandon rate over a period of time for all calls to the queue. CALL BACKS Display the following data of queue callback over a period of time: - TOTAL CALLBACKS: Display the total callback requests that are successfully made by callers over a period of time.
- FAILED CALLBACKS: Display the total failed callback attempts over a period of time.
- PENDING CALLBACKS: Display the total callbacks to be performed.
- At the top-left corner of Wallboard, select the
desired queue.
- List view for queue performance metrics
- List view for queue performance metrics present key performance metrics of all queues in a list format, making it easy to compare and analyze the performance of multiple queues.
-
- At the top-left corner of Wallboard, select
All.

- At the top-right corner of Wallboard, select the
time range of statistics to display.
- On the top of Wallboard, click the toggle button to switch to the
list view.

The queue metrics for all queues within the specified time range are displayed.
To understand each metric, you can refer to the table below.Widget Description Agents Logged In Display the number of agents logged in to the queue, and the total number of agents. Available Agents Display the number of agents logged in the queue that are ready to take a call. Active Calls Display the number of current active calls in the queue. Waiting Calls Display the number of waiting calls in the queue. Average Talking Time Display the average amount of time that an agent spends talking to a customer. Average Waiting Time Display the average call waiting time for queue calls answered over a period of time. Max Waiting Time Display the maximum call waiting time for all calls answered over a period of time. SLA Display the Service Level Agreement (SLA) for the queue. Missed Calls Display the total calls that queue missed over a period of time. Abandoned Calls Display the total calls that has been abandoned over a period of time. Answered Calls Display the total calls that queue answered over a period of time. Total Calls Display the total calls that queue received over a period of time. Missed Rate Display the missed rate over a period of time for all calls to the queue. Abandon Rate Display the abandon rate over a period of time for all calls to the queue. Answered Rate Display the answered rate over a period of time for all calls to the queue. Callbacks Display the following data of queue callback over a period of time:- Total Callbacks: Display the total callback requests that are successfully made by callers over a period of time.
- Failed Callbacks: Display the total failed callback attempts over a period of time.
- Pending Callbacks: Display the total callbacks to be performed.
- At the top-left corner of Wallboard, select
All.
- List view for queue agent status
- List view for queue agent status allows you to track agents' presence status, logged in/out status, call statistics, and more in a clear, organized list view.
-
- At the top-left corner of Wallboard, select the
desired queue.
- At the top-right corner of Wallboard, select the
time range of statistics to display.
- On the top of Wallboard, click the toggle button to switch to the
list view.

The agent status for all queues or a single queue within the specified time range are displayed.
To understand each metric, you can refer to the table below.
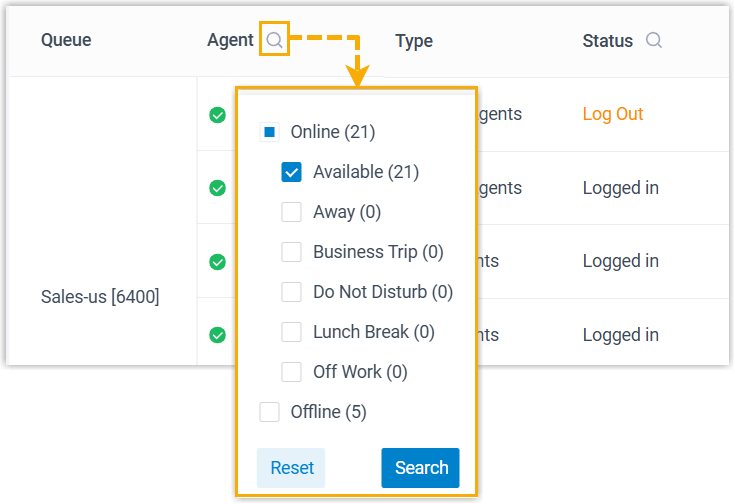
Widget Description Queue Display the queues you manage. Agent Display the name, extension number, and extension presence of agents. You can filter the desired agents from the list by the online status of the extensions.
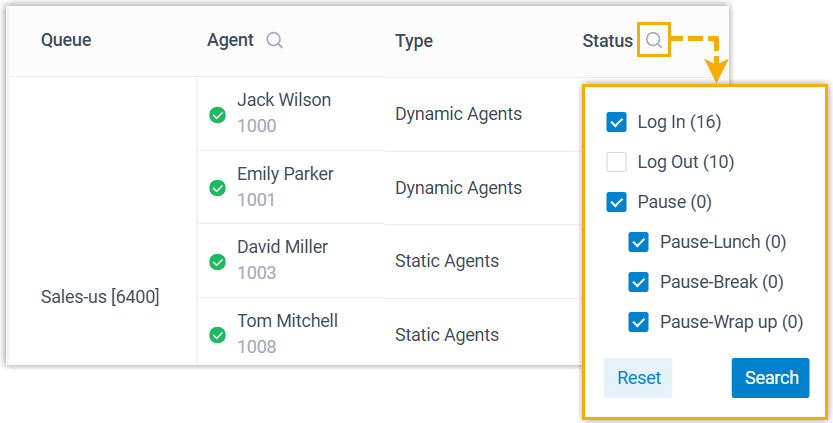
Type Display the type of agents. Status Display the status of agents. You can filter the desired agents from the list by agent status.
Time Display the time for each status. - If Status is
Logged in,
Time shows the last time
the dynamic agent logged in to the queue.Note: For static agent, Time shows
-. - If Status is
Log Out,
Time shows the last time
the dynamic agent logged out of the queue.Note: For static agent, Time shows
-. - If Status is Paused, Time shows how long the agent paused service.
Active Calls Display the total number of calls in the queue that the agent is answering.
Tip: Click on the number, then you will be redirected to Queue Panel to view the calls the agent is answering.Max Talking Time for Current Active Calls Display the maximum amount of time that the agent spends talking to a customer among all calls in the queue. Answered Calls Display the total number of calls that the agent answered over a period of time. Missed Calls Display the total number of calls that the agent missed over a period of time. Total Talking Time Display the total talking time that the agent answered queue calls over a period of time.
- If Status is
Logged in,
Time shows the last time
the dynamic agent logged in to the queue.
- At the top-left corner of Wallboard, select the
desired queue.
(Optional) Step 3. Display Wallboard independently
Set the Wallboard to display independently in a separate browser window.
- At the top-right corner of Wallboard, click
 .
.
- Optional: Set the Wallboard to automatically toggle between wallboard
view and list view with a scrolling display.
- At the top-right corner of Wallboard, click
Settings to set the time to toggle, then save
the setting.
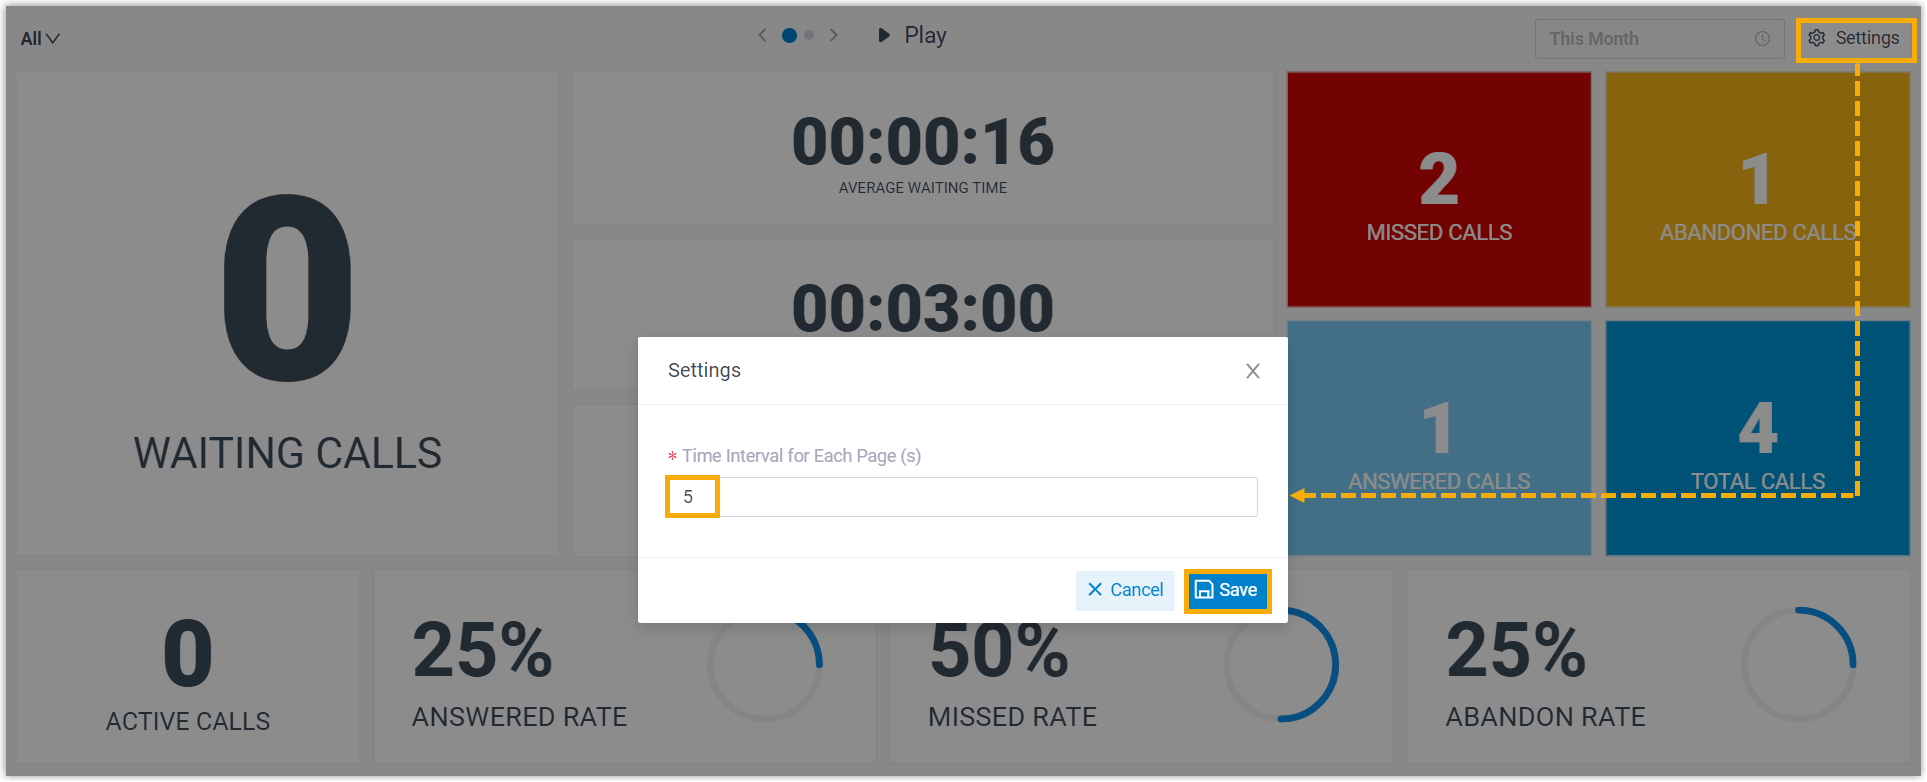
- On the top of Wallboard, click Play.
The Wallboard automatically toggles between wallboard view and list view with a scrolling display at the specified time interval.
- At the top-right corner of Wallboard, click
Settings to set the time to toggle, then save
the setting.