Import PBX Data from a Database into Grafana
When PBX data is synchronized to a third-party database, you can add the database as a data source in Grafana, then use the Yeastar-provided dashboard template to import and visualize your data on Grafana.
Requirements
| Platform | Requirement |
|---|---|
| Grafana | An account with Organization administrator role. |
| Third-party Database |
|
Prerequisites
Procedure
Step 1. Connect Grafana to database
- Log in to Grafana portal, go to .
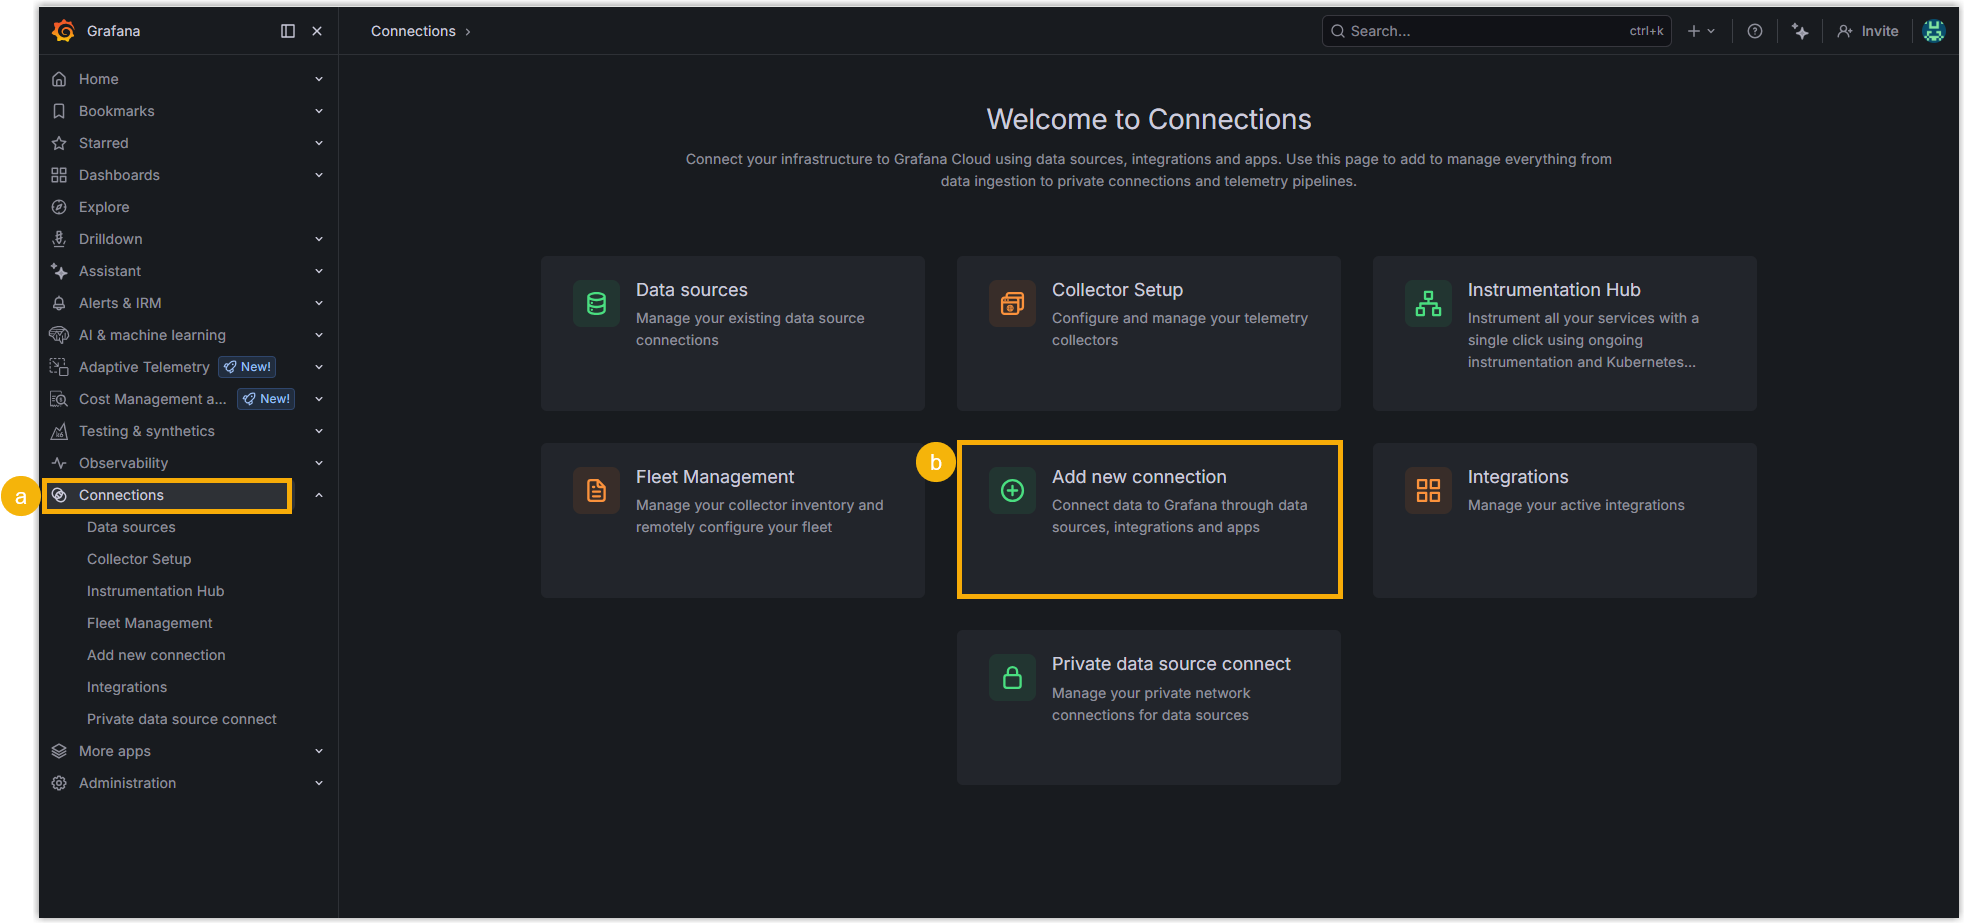
- Add a data source.
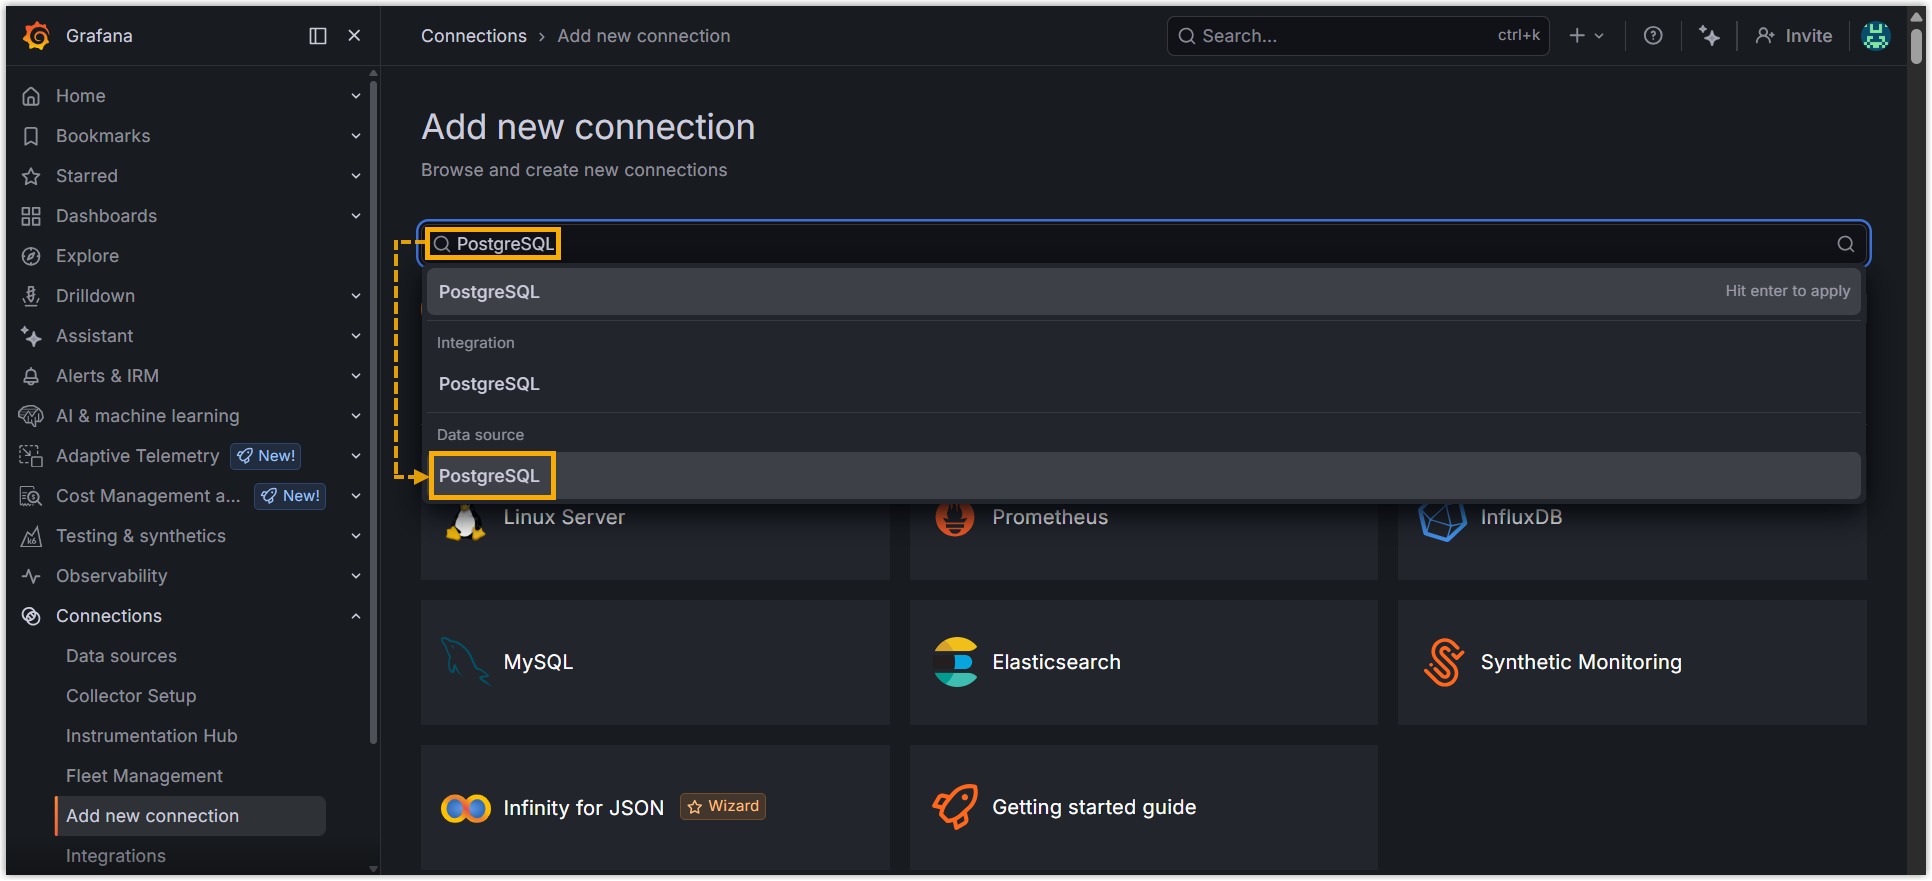
- Search for the target database type and select it from the list of
available data sources.
In this example, select PostgreSQL data source.
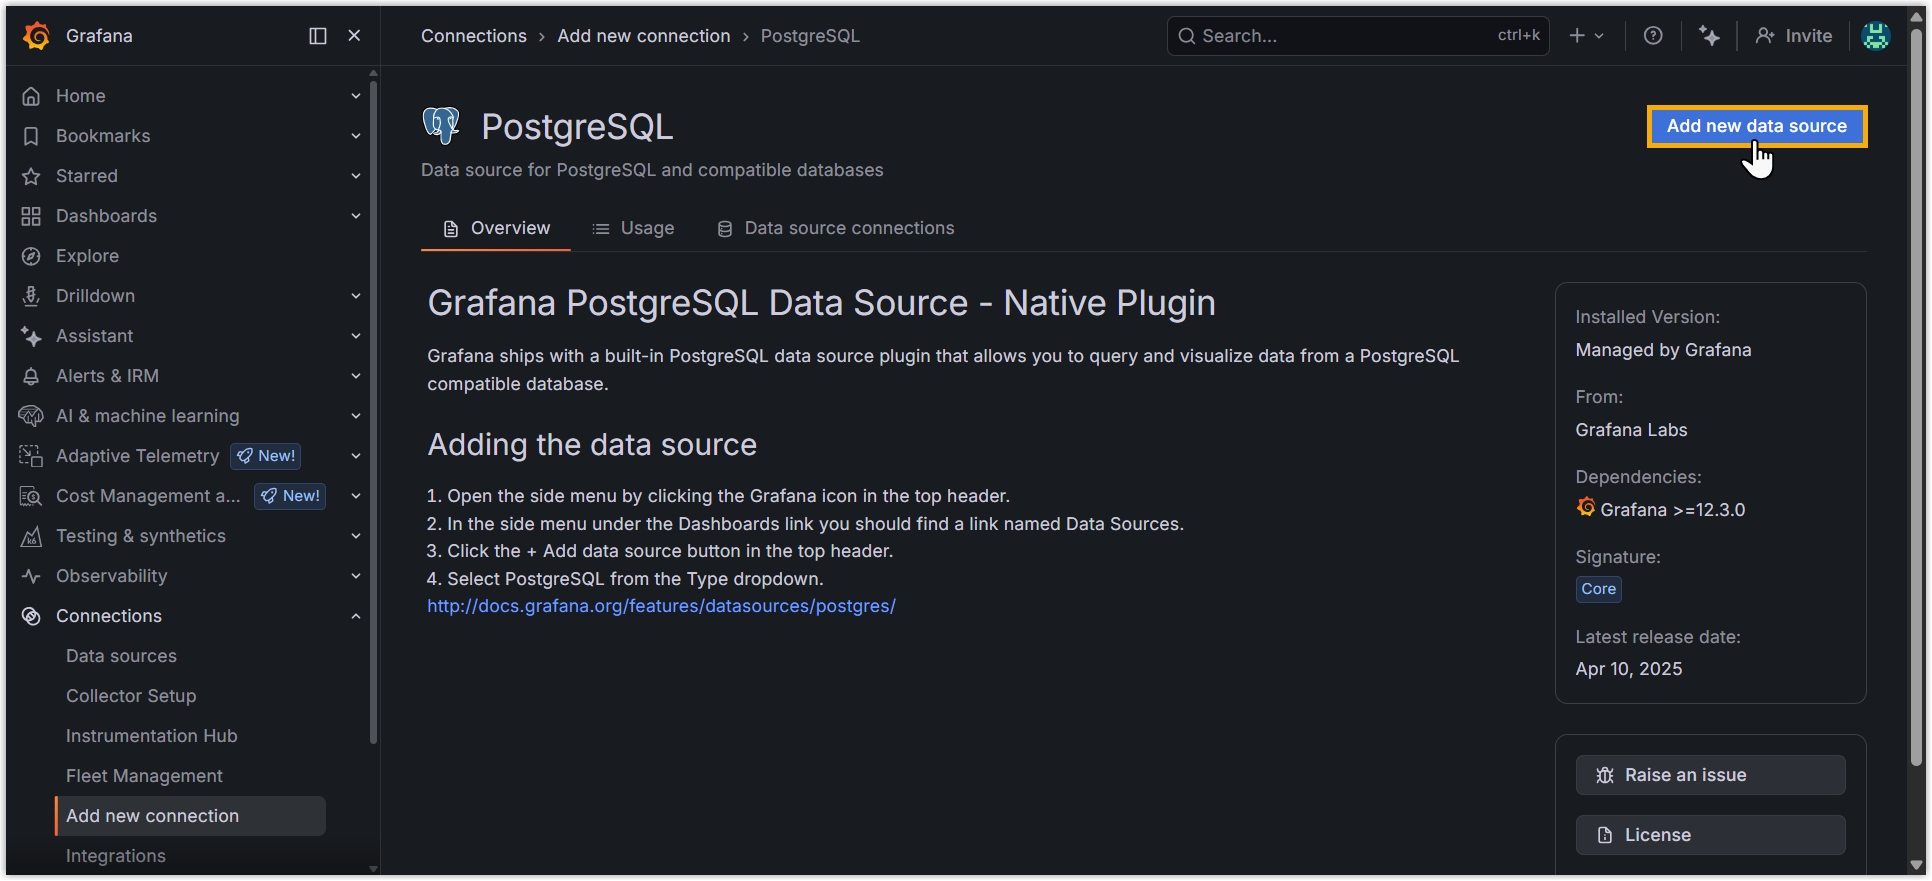
- At the top-right corner, click Add new data
source.
- Search for the target database type and select it from the list of
available data sources.
- Fill in the following information to connect to the database.
- In the Connection section, fill in the
database connection information.
Item Description Host URL Enter the IP address or domain name of the host on which the database is installed, as well as the database port. Database name Enter the name of the database. - In the Authentication section, fill in the
authentication information.
Item Description Username Enter the username used to connect to the database. Password Enter the password used to connect to the database.
- In the Connection section, fill in the
database connection information.
- Optional: Configure additional settings as needed.
- Scroll down to the bottom of the page, click Save &
test to test and save the data source connection.
If "Database Connection OK" is displayed, it indicates that the connection to the database is successful.
Step 2. Import a dashboard from the database using a template
- In the browser's address bar, copy the data source UID (the last segment of
the URL) for template configuration.
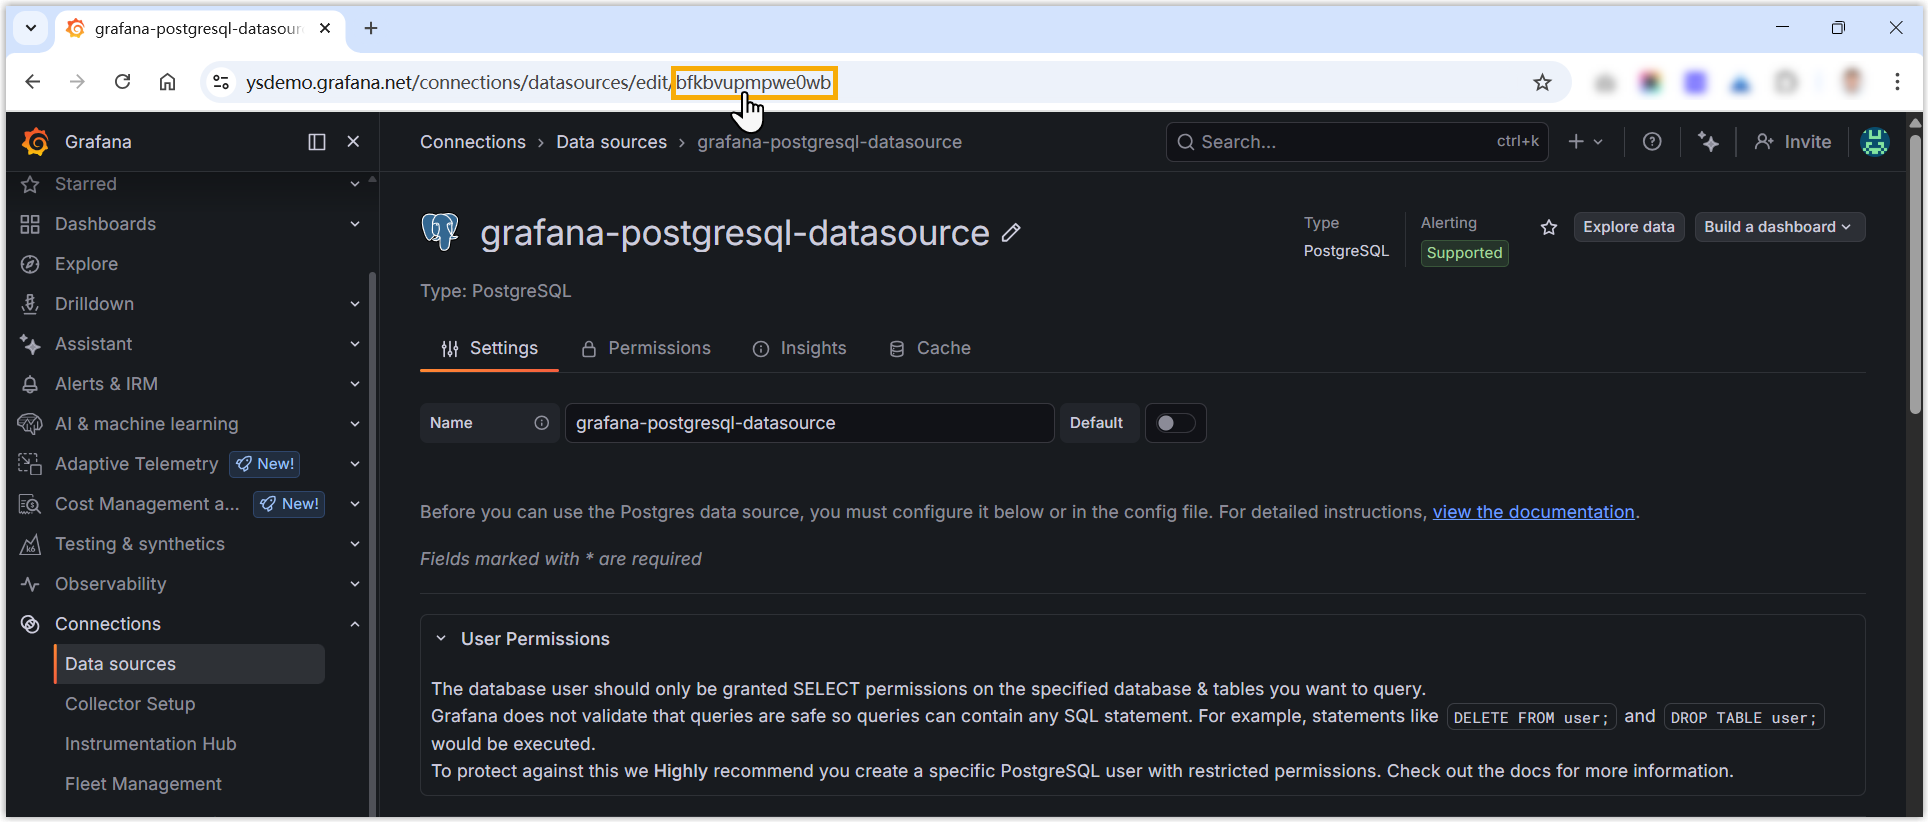
In this example, the value we retrieve is
bfkbvupmpwe0wb. - Download and update the dashboard JSON template.
-
Download and unzip the dashboard template package, which includes templates for different databases, and select the appropriate one based on your database.
In this example, we will use the template for PostgreSQL.

- Replace all
uidvalues underdatasourcein each panel with the retrieved values.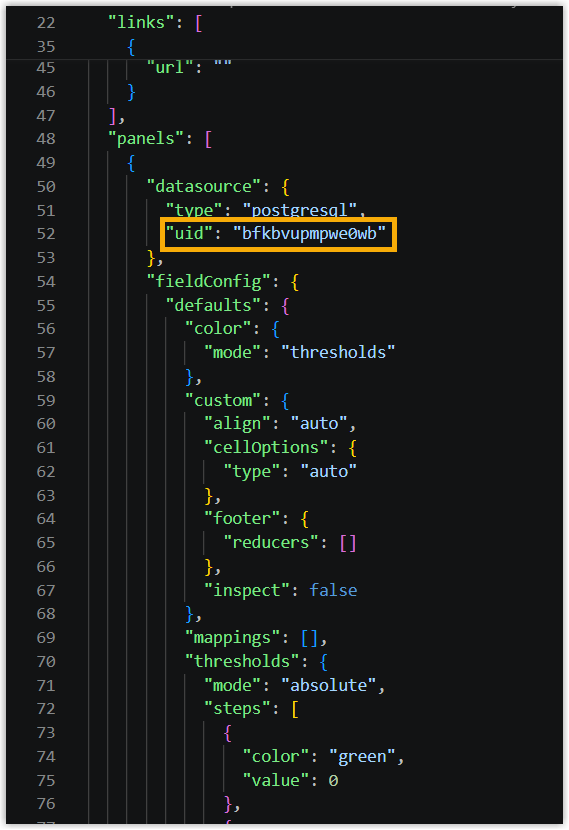 Note: Leave the
uidvalues in annotations and dashboard settings unchanged.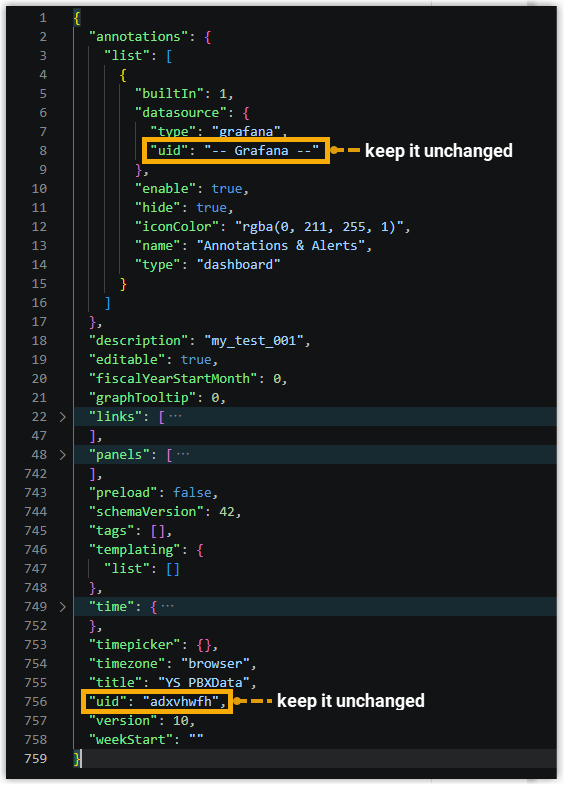
- Optional: Update the
titlevalue, which will be used as the dashboard name in Grafana.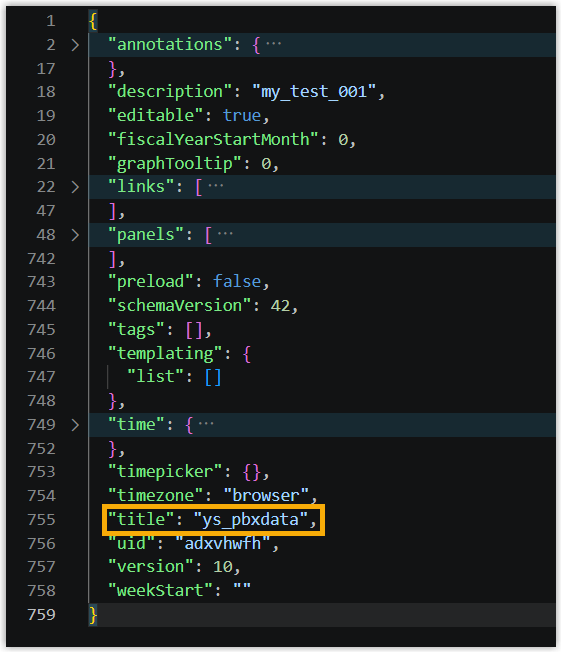
-
- Import the dashboard template to Grafana.
- On the left navigation bar, click Dashboards.
- At the top-right corner, click
 and select
Import dashboard.
and select
Import dashboard.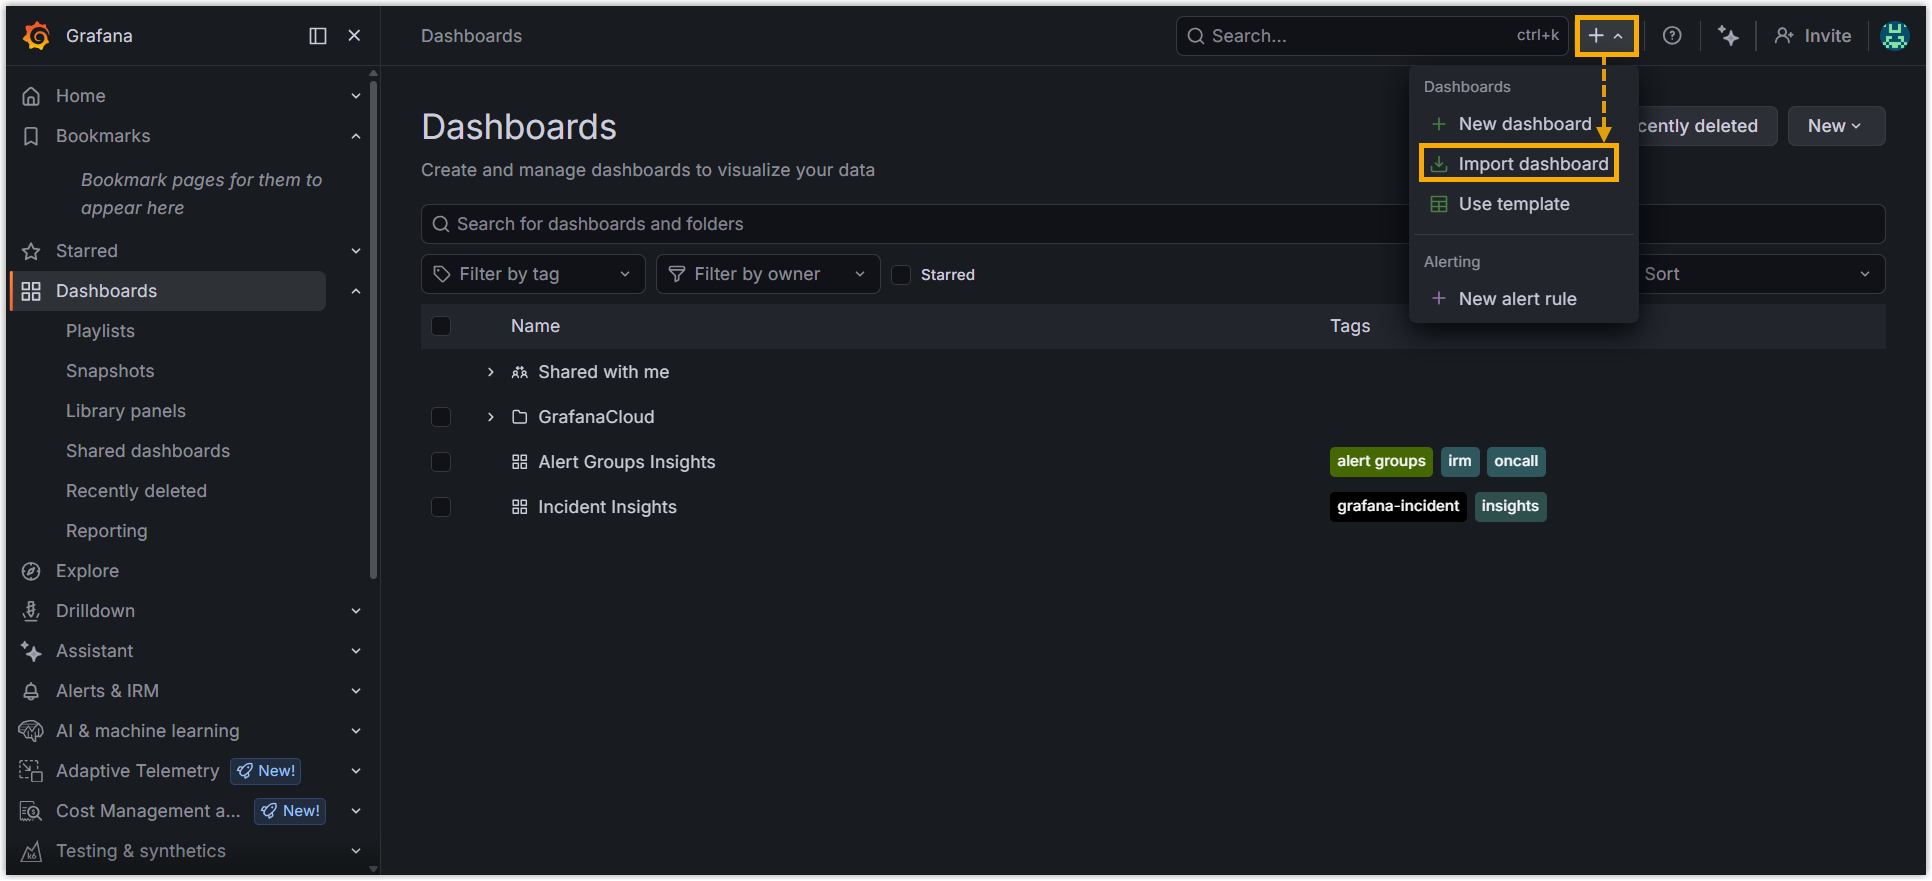
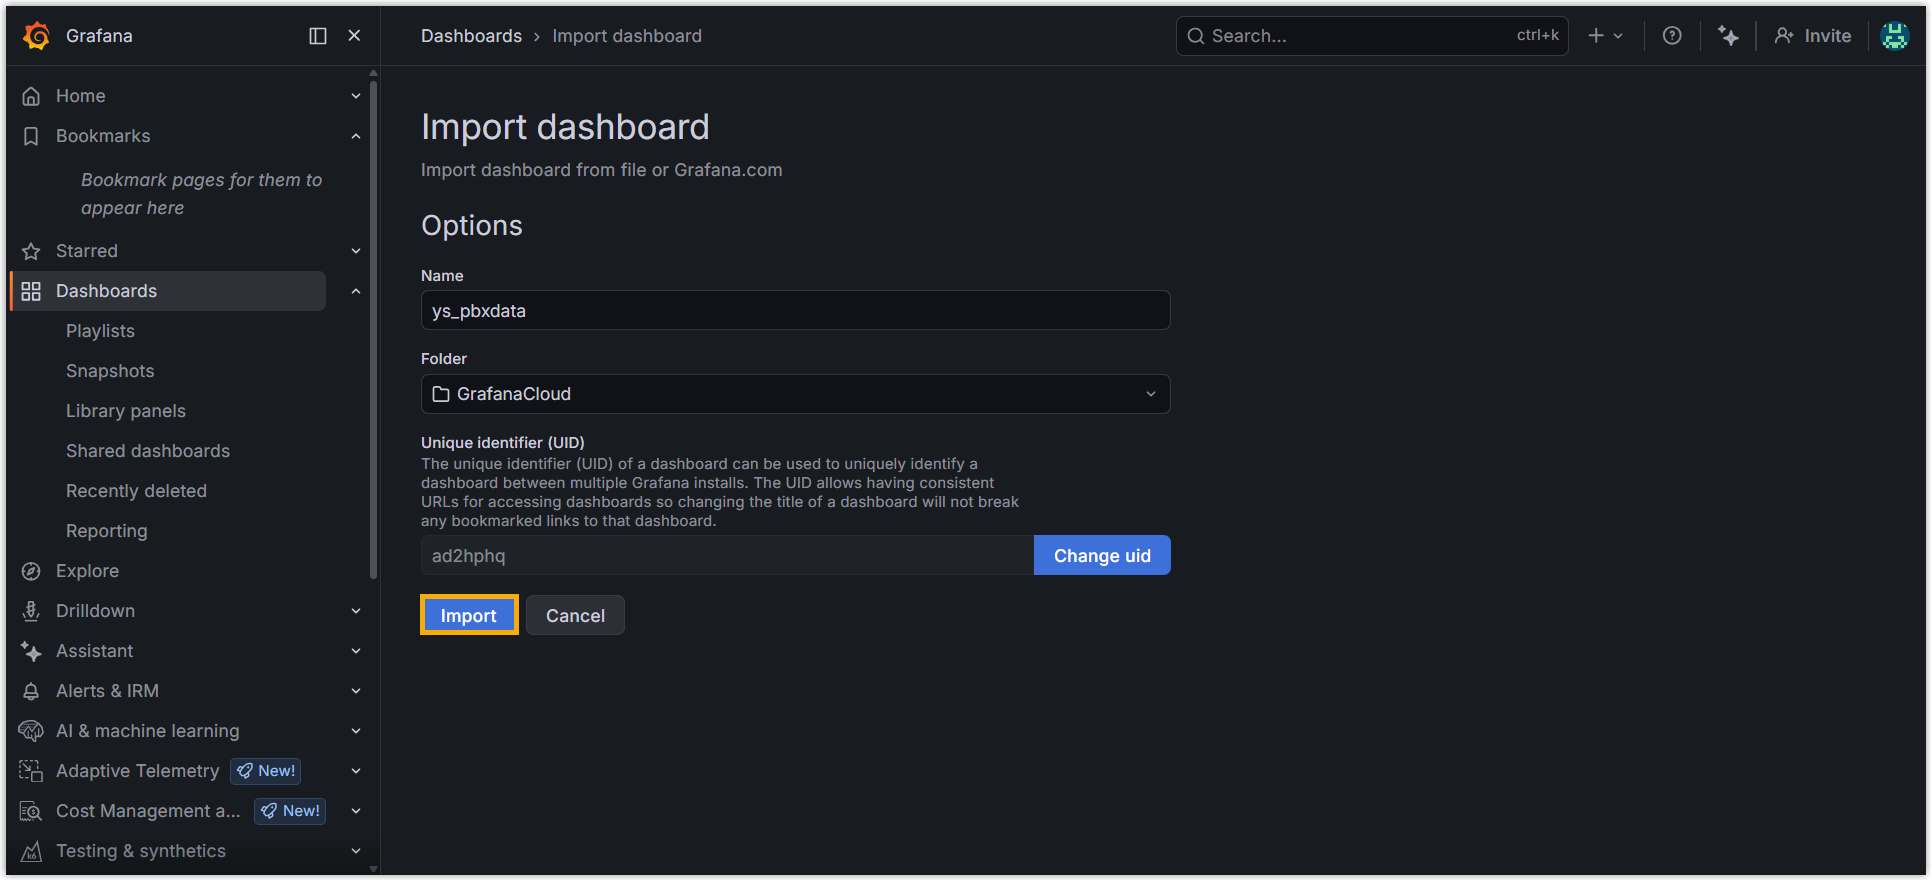
- Click Upload dashboard JSON file and upload
the
.jsonfile. - Click Import.
Result
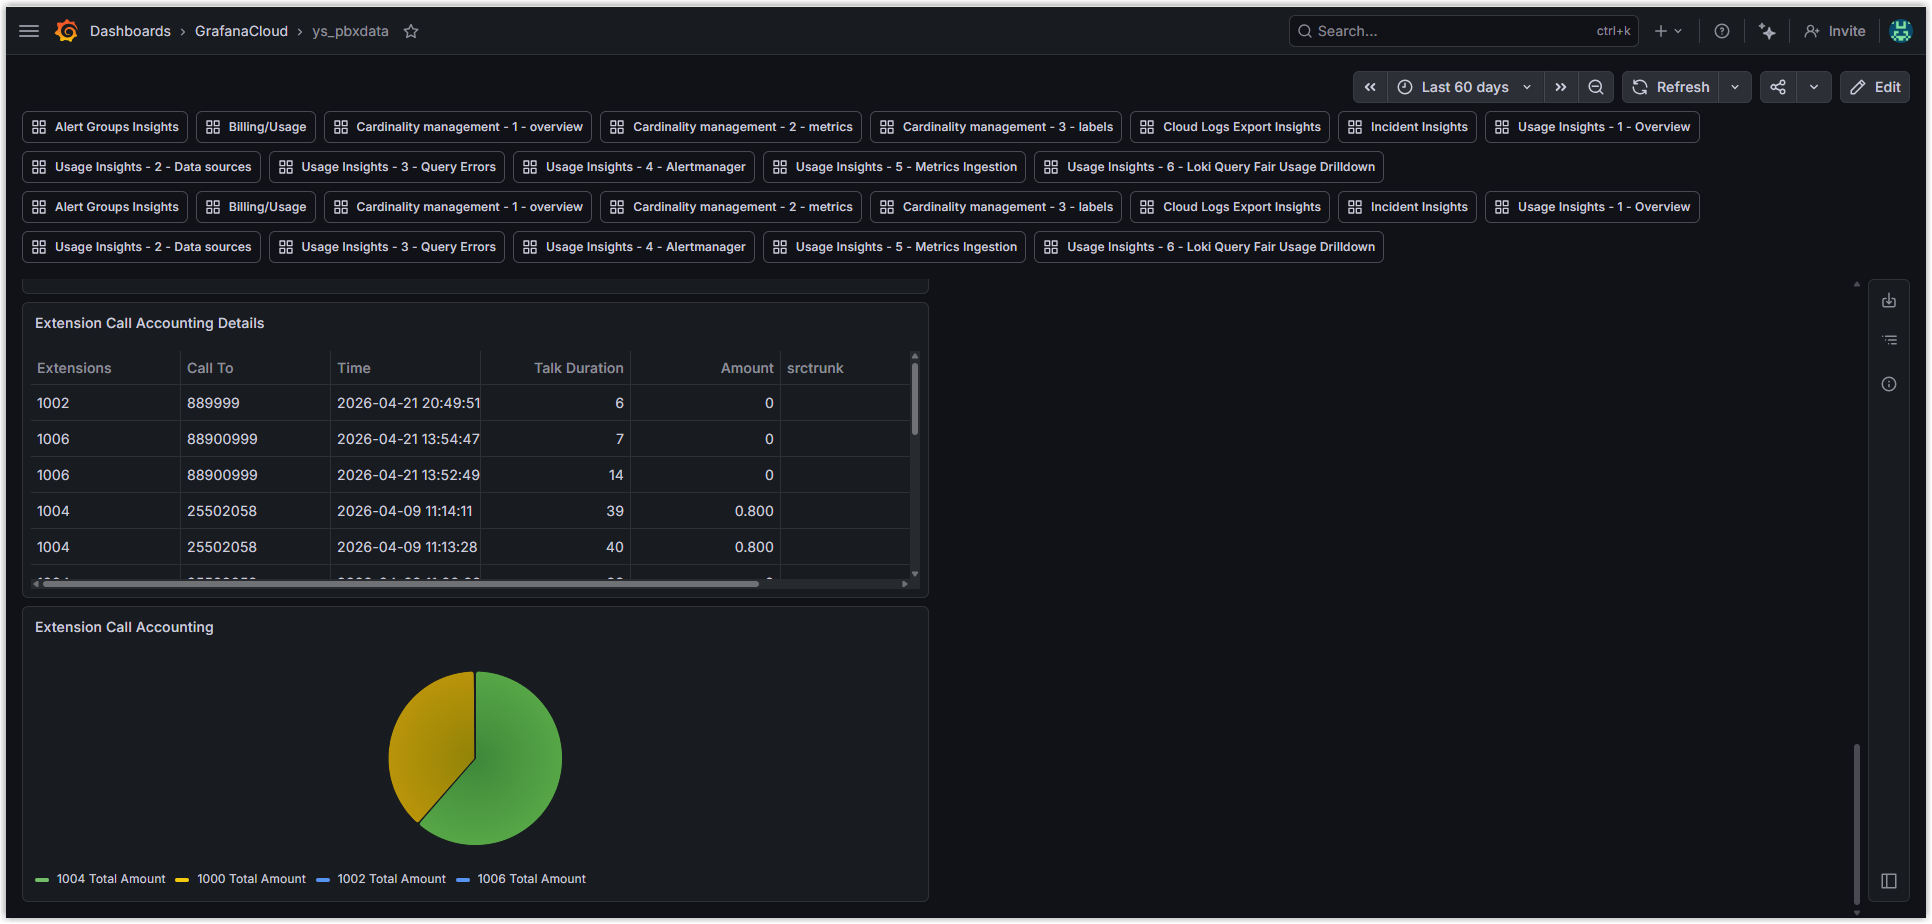
The dashboard is successfully imported and data is visualized in the Dashboard.
What to do next
Add or modify the SQL queries to customize the data to be displayed.-
Extension Call Accounting
-
Extension Call Accounting Details
-
Agent Missed Call Activity
-
Queue Callback Activity
-
Satisfaction Survey
-
Satisfaction Survey Details
-
IVR Report
-
DID/Outbound Caller ID Activity
To display additional call reports, you can add SQL queries as needed. Refer to Call Report Calculations with Multiple SQL Queries for more details on the related data logic.