Configure Debug Mode
You can configure debug mode to generate detailed logs for troubleshooting if needed. This topic describes how to configure debug mode to start a debug.
Background information
NovoOne Platform runs all core services (SIP, media, gateway, routing, database, cache, etc.) on Kubernetes as independent microservice instances. You can configure debug mode to control which service logs are generated during the debug period to quickly locate service exceptions and performance issues.
Procedure
- Log in to NovoOne Platform portal, go to .
- In the Settings section, click Manage
Debug for the Debug Mode.
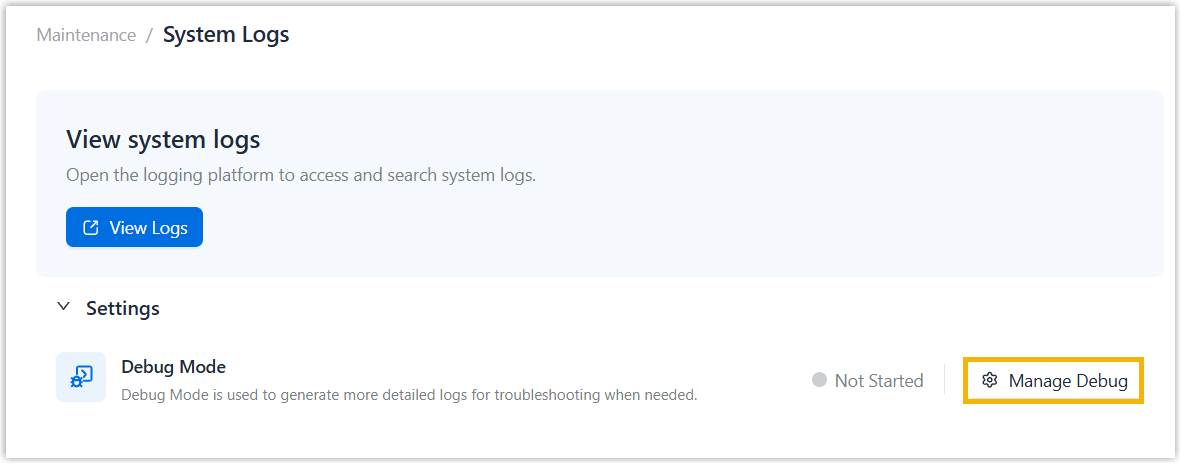
- In the pop-up window, configure the debug mode.
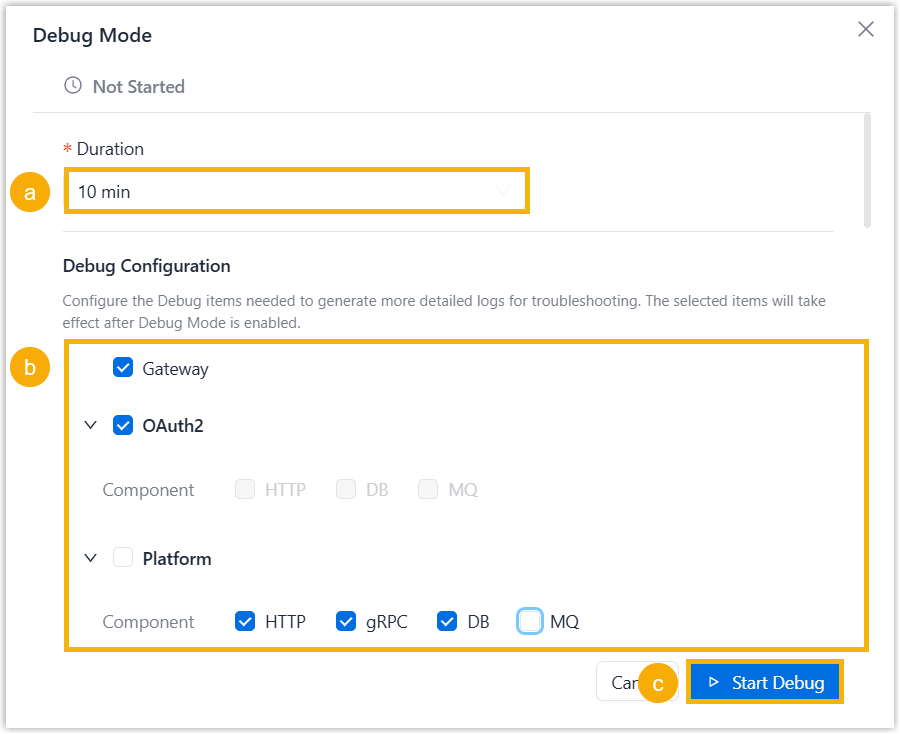
- In the Duration drop-down list, select the debug time period.
- In the Debug Configuration section, select
debug items or their sub-options needed to be logged for
troubleshooting.Note: If you select the checkbox of a parent item, full debug logs of the corresponding service will be recorded. If a sub-option checkbox is selected, only the debug logs for the sub-item under the service will be recorded.
- Click Start Debug.
Result
The debug starts, running with an active countdown timer.

Note:
- You can click Stop to close the debug.
- Once debugging is complete, you can view the system logs. For more information, see View System Logs.