Dashboard Overview
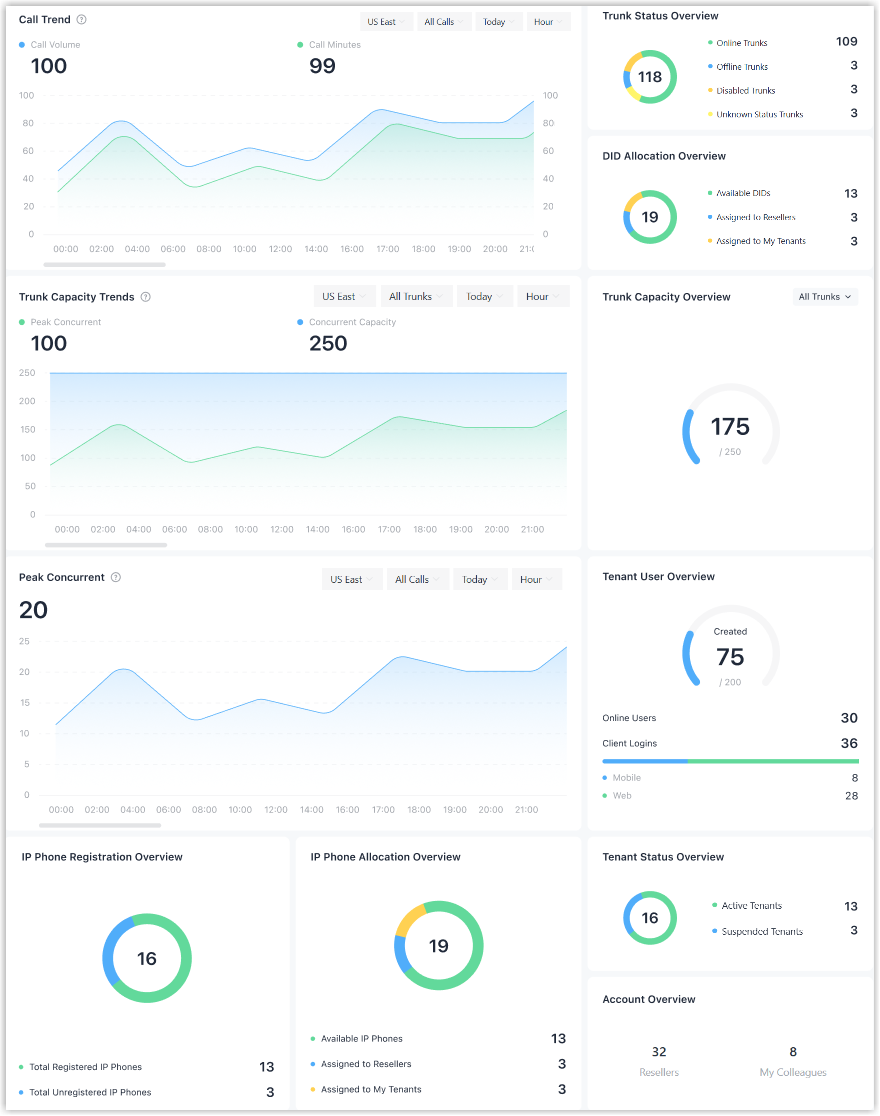
Dashboard is a collection of widgets that provide real‑time and historical resource usage and call‑activity data, helping you monitor resource usage, evaluate capacity needs, and identify trends. This topic describes detailed metrics of supported widgets.
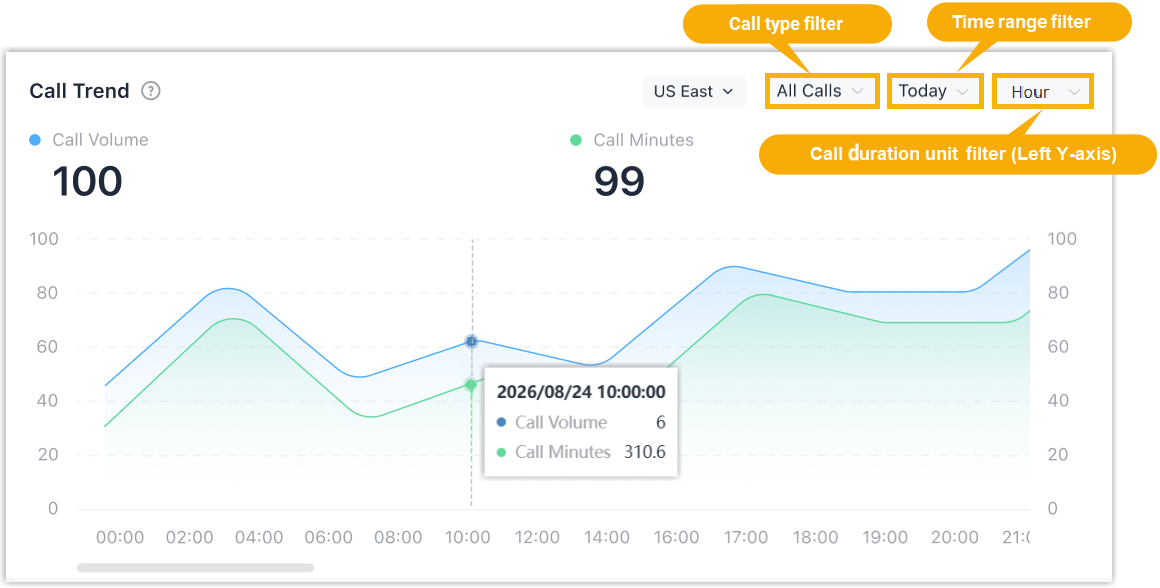
Call Trend
- You can filter the data by call type, time range and call duration unit to focus on the information you need.
- You can hover over the widget to view the call volume and call minutes at each time point.
| Metric | Description |
|---|---|
| Call Volume | The total number of calls within the selected time range. |
| Call Minutes | The total number of call minutes within the selected time range. |
Peak Concurrent
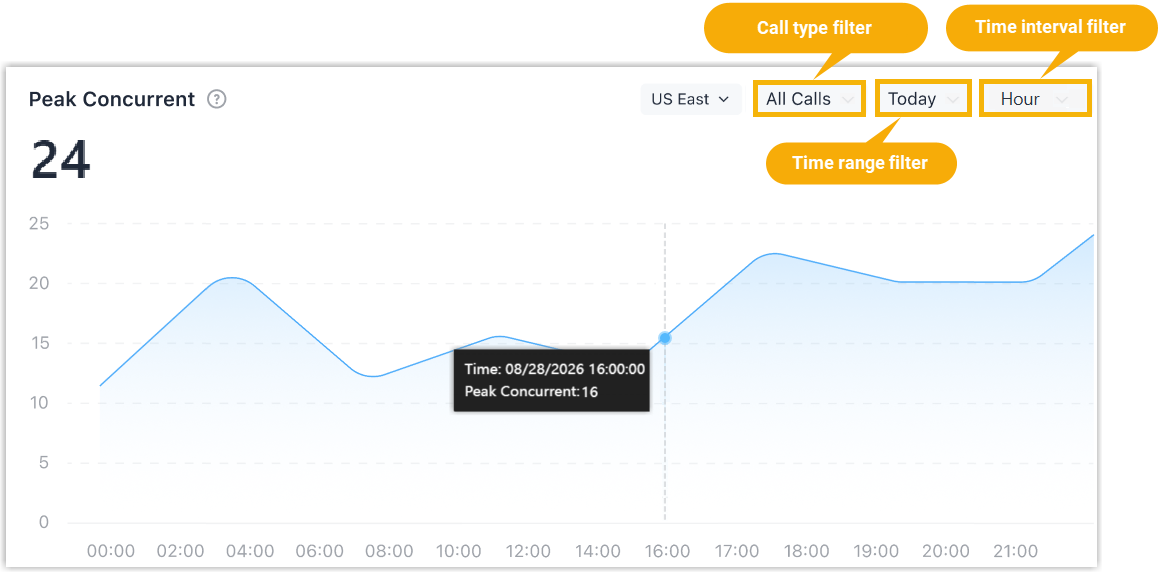
Displays the peak number of concurrent calls routed though SIP trunks owned by you and your resellerswithin the selected time range, helping identify peak call traffic and evaluate concurrent call demand.
- You can filter the data by call type, time range and time interval to focus on the information you need.
- You can hover over the widget to view the peak number of concurrent calls within selected time interval at each time point. For example, if the Time interval filter is set to Hour, each data point represents the peak number of concurrent calls over the past one hour.
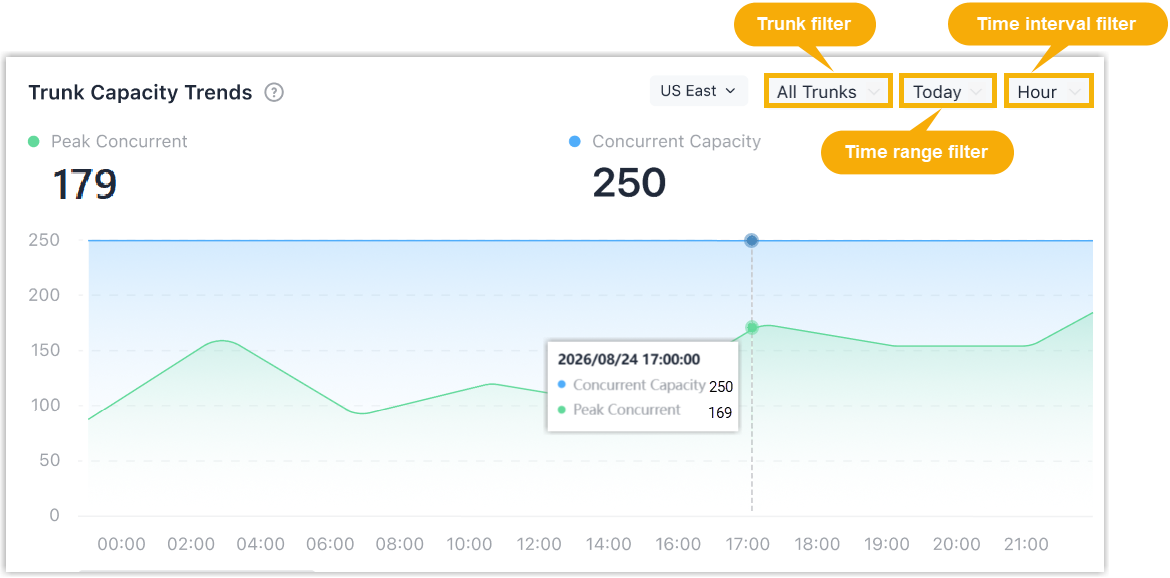
Trunk Capacity Trends
- You can filter the data by trunk type, time range and time interval to focus on the information you need.
- You can hover over the widget to view the concurrent call capacity and the peak concurrent calls at each time point.
| Metric | Description |
|---|---|
| Peak Concurrent | The peak number of concurrent calls within the selected time
range. Note: The corresponding line in
the chart below shows peak numbers of concurrent calls
within selected time interval. For example, if the Time interval filter is set to Hour, each data point represents the peak number of concurrent calls over the past one hour. |
| Concurrent Capacity | The concurrent call limit of the SIP trunk. Note: This metric and corresponding line are
displayed only when the concurrent calls for all SIP trunks
are limited. |
Trunk Status Overview
Display the numbers of SIP trunks (owned by you and your resellers)by status , enabling you to quickly identify trunk connectivity and anomalies.
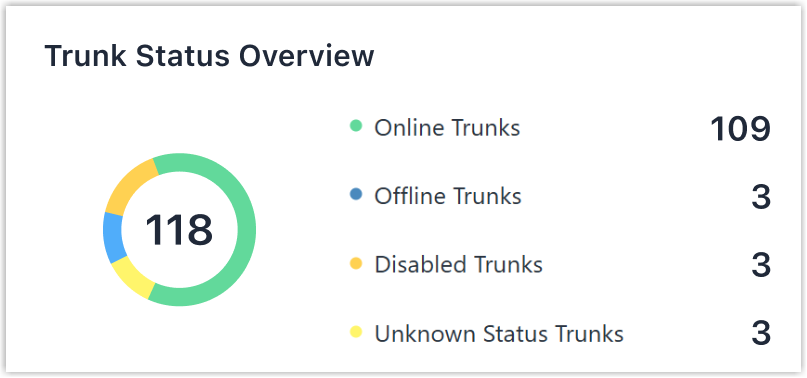
| Metric | Description |
|---|---|
| Donut chart | The total number of SIP trunks. |
| Online Trunks | The number of SIP trunks with a status of Registered, Reachable and Busy. |
| Offline Trunks | The number of SIP trunks with a status of Registration Failed, Authentication Failed and Unreachable. |
| Disabled Trunks | The number of SIP trunks with a status of Disabled. |
| Unknown Status Trunks | The number of SIP trunks with a status of Unmonitored, and Registering. |
Trunk Capacity Overview
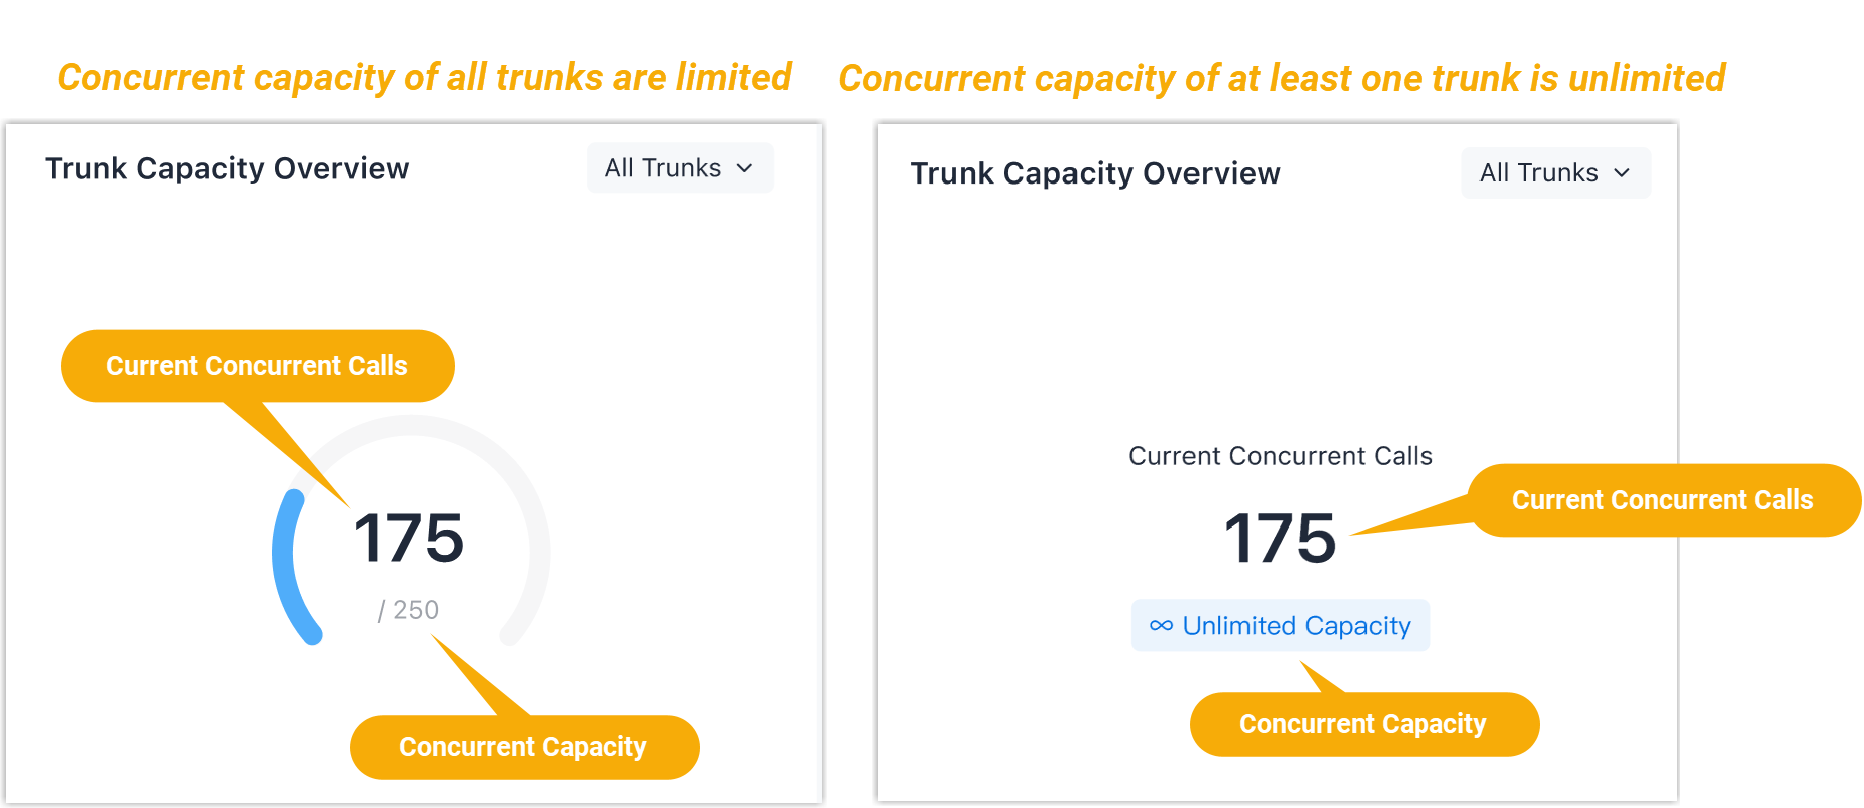
| Metric | Description |
|---|---|
| Current Concurrent Calls | The number of concurrent calls currently active on all SIP trunks. |
| Concurrent Capacity | The concurrent call limit of all SIP trunks. Note: If any trunk within the selected filter
has unlimited concurrent capacity, this metric displays
Unlimited Capacity. |
DID Allocation Overview
Display the allocation of DID numbers (owned by you and your resellers). It helps you assess DID inventory and resource assignment.
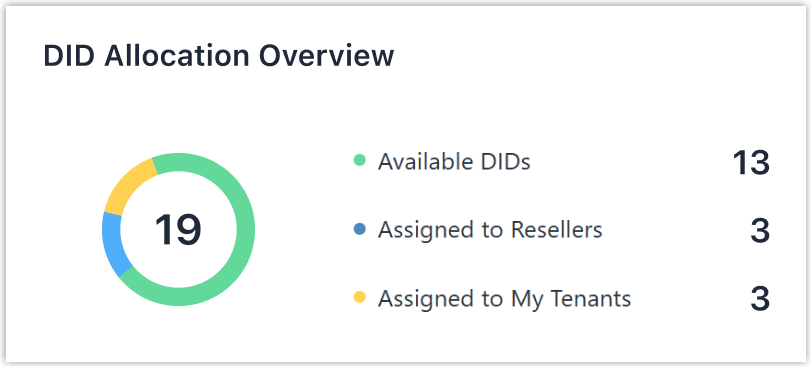
| Metric | Description |
|---|---|
| Donut chart | The total number of DID numbers. |
| Available DIDs | The number of DID numbers not assigned to any reseller or tenant. |
| Assigned to Resellers | The number of DID numbers assigned to resellers or their tenants. |
| Assigned to My Tenants | The number of DID numbers assigned to your tenants. |
Tenant User Overview
Displays the details of tenant users created in your and your resellers' tenants, including their online status and client login activity.
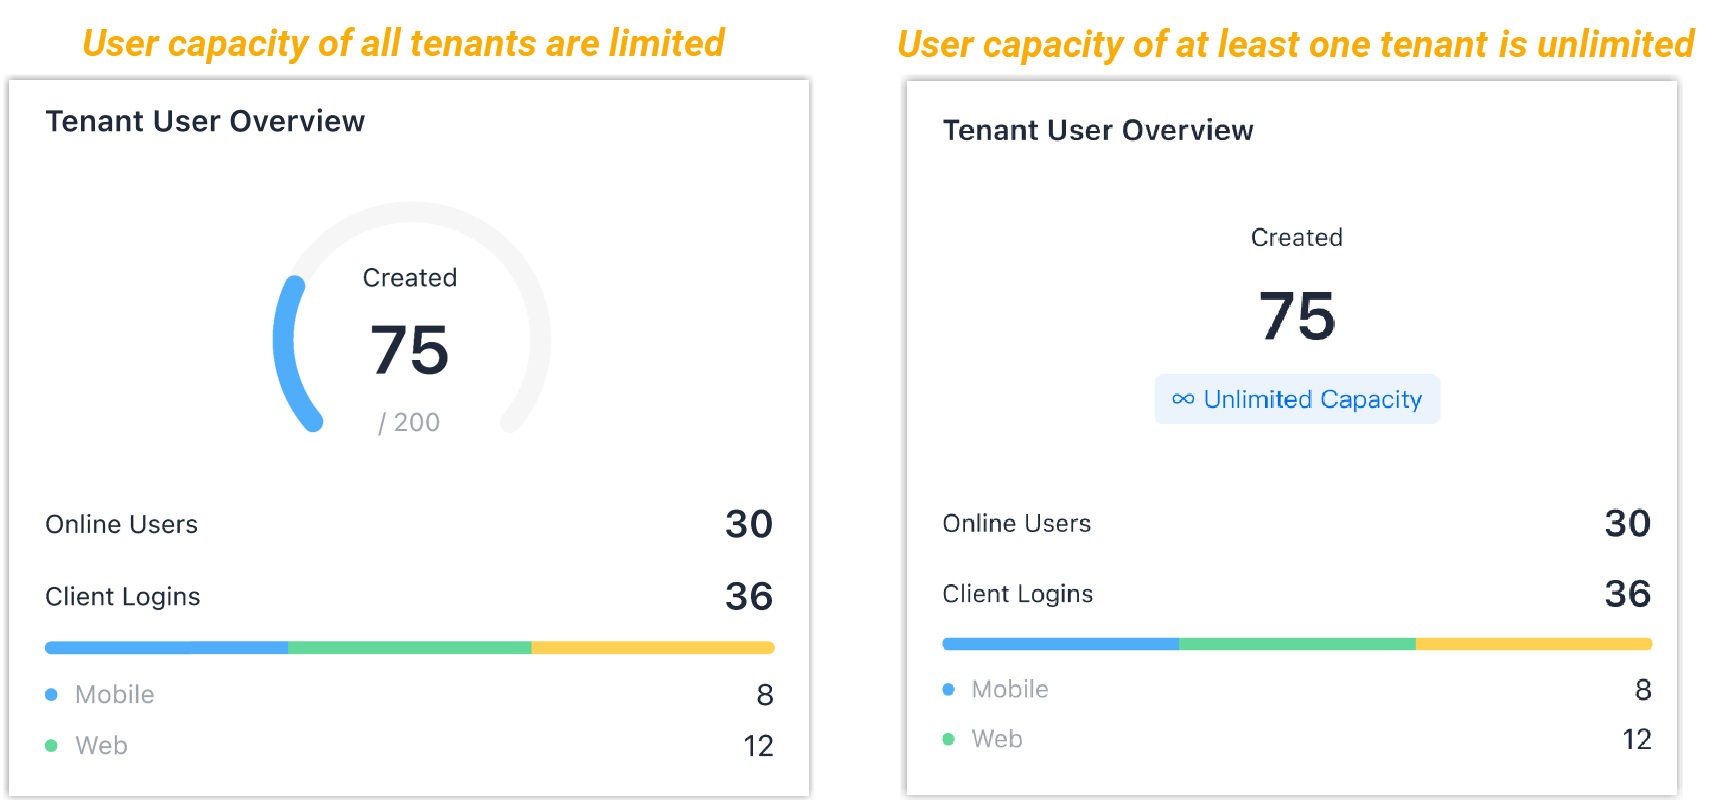
| Metric | Description |
|---|---|
| Donut chart | The total number of created tenant users / the user
capacity. Note: If any tenant has unlimited
user capacity, this metric displays Unlimited
Capacity. |
| Online Users | The number of tenant users who have registered to any client. |
| Client Logins | The number of logged-in clients. |
Tenant Status Overview
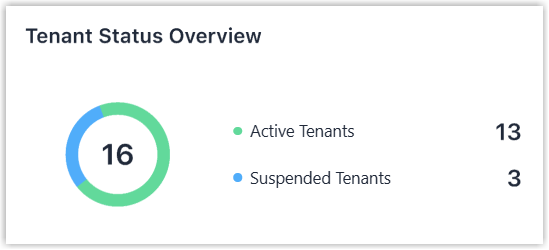
Display the number of your and your resellers' tenants by status, enabling you to quickly grasp tenant operational status.
| Metric | Description |
|---|---|
| Donut chart | The total number of tenants. |
| Active Tenants | The number of tenants with a status of Active. |
| Suspended Tenants | The number of tenants with a status of Suspended. |
IP Phone Registration Overview
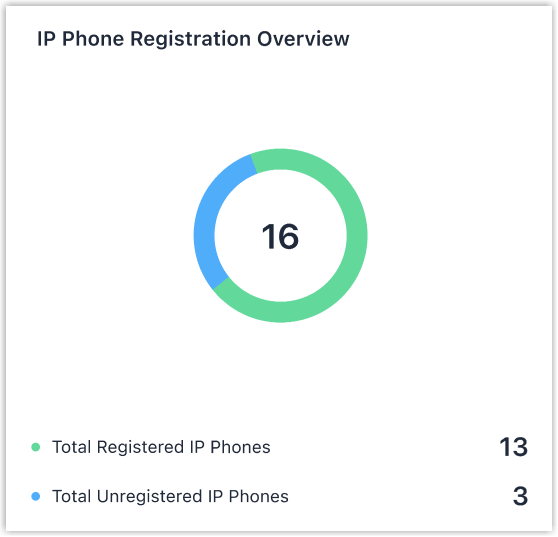
Display the total number, registered number, and unregistered number of IP phones owned by you, your resellers, your tenants, and your resellers' tenants, enabling you to track device real-time deployment and utilization.
| Metric | Description |
|---|---|
| Donut chart | The total number of IP phones. |
| Total Registered IP Phones | The number of IP phones successfully registered with tenant users. |
| Total Unregistered IP Phones | The number of unregistered IP phones. |
IP Phone Allocation Overview
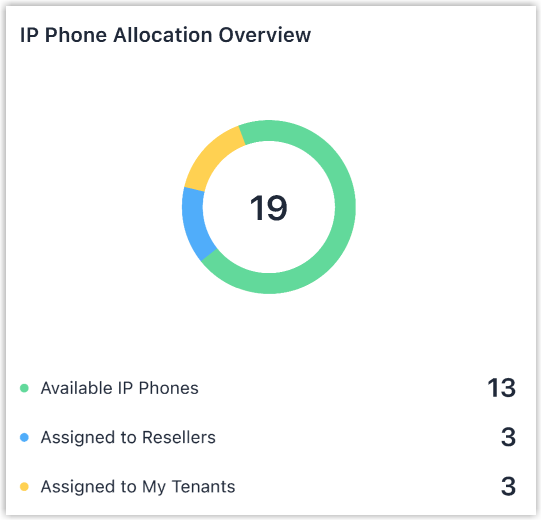
Display the allocation of IP phones owned by you, your resellers, your tenants, and your resellers' tenants. It helps you track IP phone inventory and resource flow.
| Metric | Description |
|---|---|
| Donut chart | The total number of IP phones. |
| Available IP Phones | The number of IP phones not assigned to any reseller or tenant. |
| Assigned to Resellers | The number of IP phones assigned to your resellers. Note: IP phones owned by resellers' tenants
count towards Assigned to
Resellers. |
| Assigned to My Tenants | The number of IP phones assigned to your tenants. Note: IP phones owned by your tenants count
towards Assigned to My
Tenants. |
Account Overview
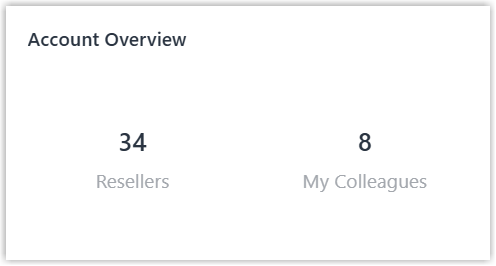
Display a summary of the accounts , enabling you to understand the scale of reseller accounts and colleague accounts.
| Metric | Description |
|---|---|
| Resellers | The total number of reseller accounts. |
| My Colleagues | The total number of colleague accounts. |