Check System Resources of a P-Series Cloud PBX
Yeastar Central Management allows you to monitor the system resources of a specific P-Series Cloud PBX through a monitoring window. This helps you track and analyze the PBX system performance, promptly detect and resolve issues, and adjust the capacity subscription for your customers accordingly.
Requirements
The firmware version of the P-Series Cloud PBX is 84.15.0.22 or later.
Procedure
- Log in to Yeastar Central Management, go to .
- Click
 beside the desired PBX.
A resource monitoring window of the PBX pops up.
- Check the metrics and trends in the pop-up window according to your need.Tip: To view more granular details, click
 and drag the portion of the visualization that you
want to magnify; To revert to a previous zooming operation, click
and drag the portion of the visualization that you
want to magnify; To revert to a previous zooming operation, click
 .
.
Check resource offline condition
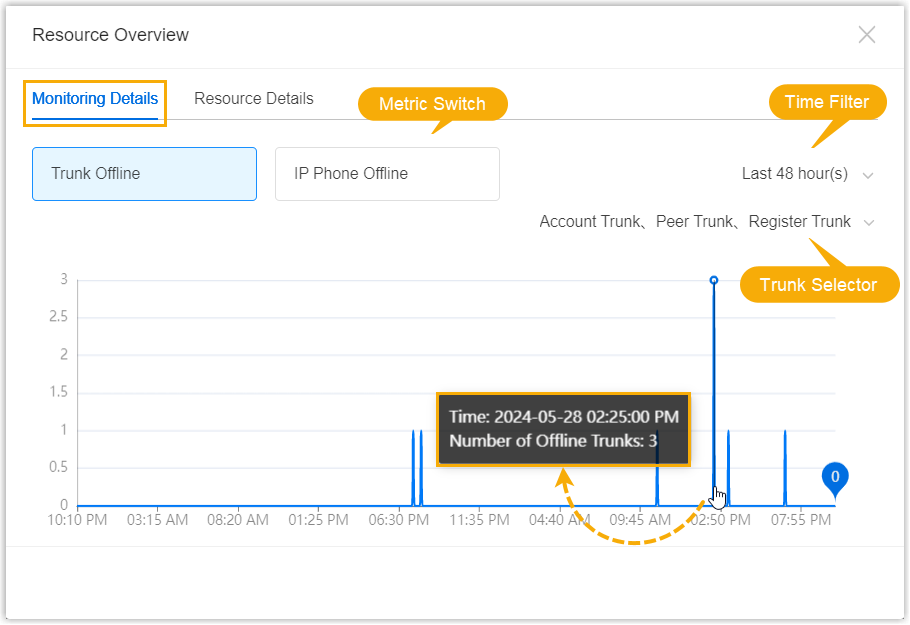
| Metric | Description |
|---|---|
| Trunk Offline | Show the disconnection condition of SIP trunks (Account
Trunk, Peer Trunk, and Register Trunk). Note: The WebRTC trunks are not
included. |
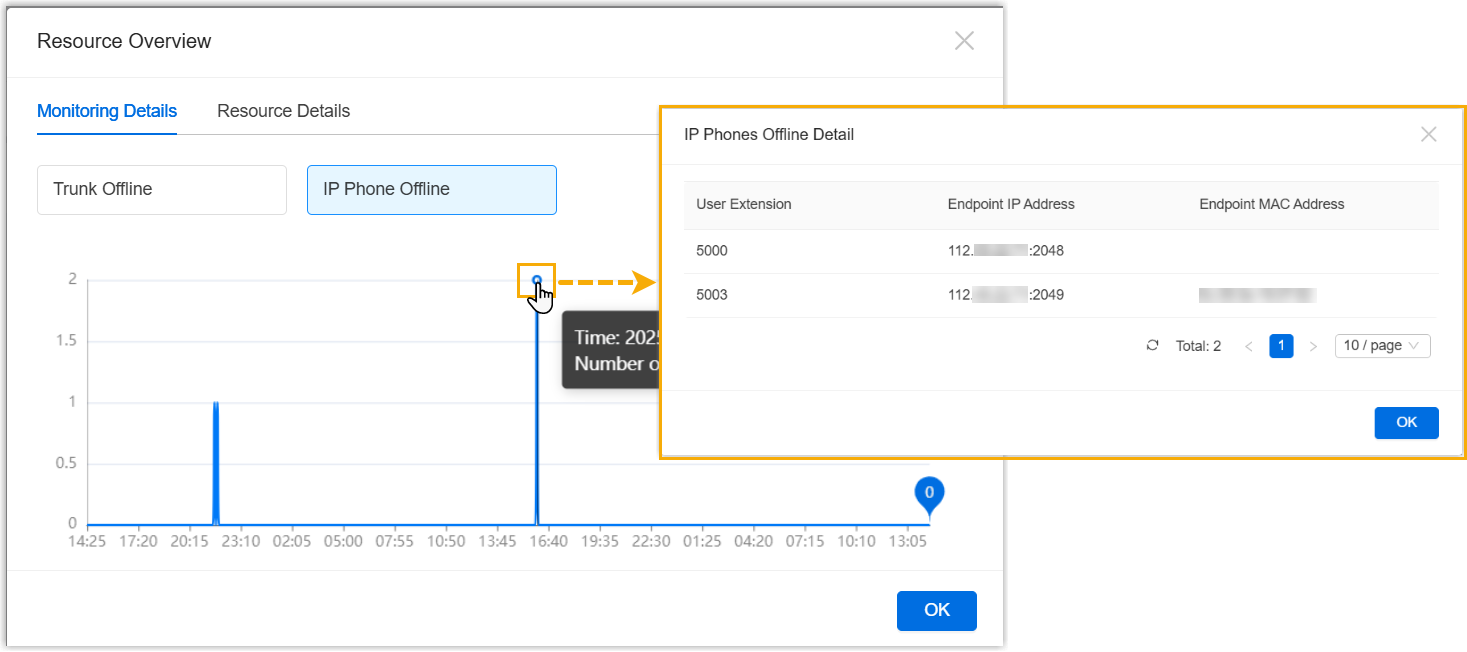
| IP Phone Offline | Show the disconnection condition of the IP phones or
softphones on which the PBX extensions are registered. Note: Linkus
clients
are not included. |
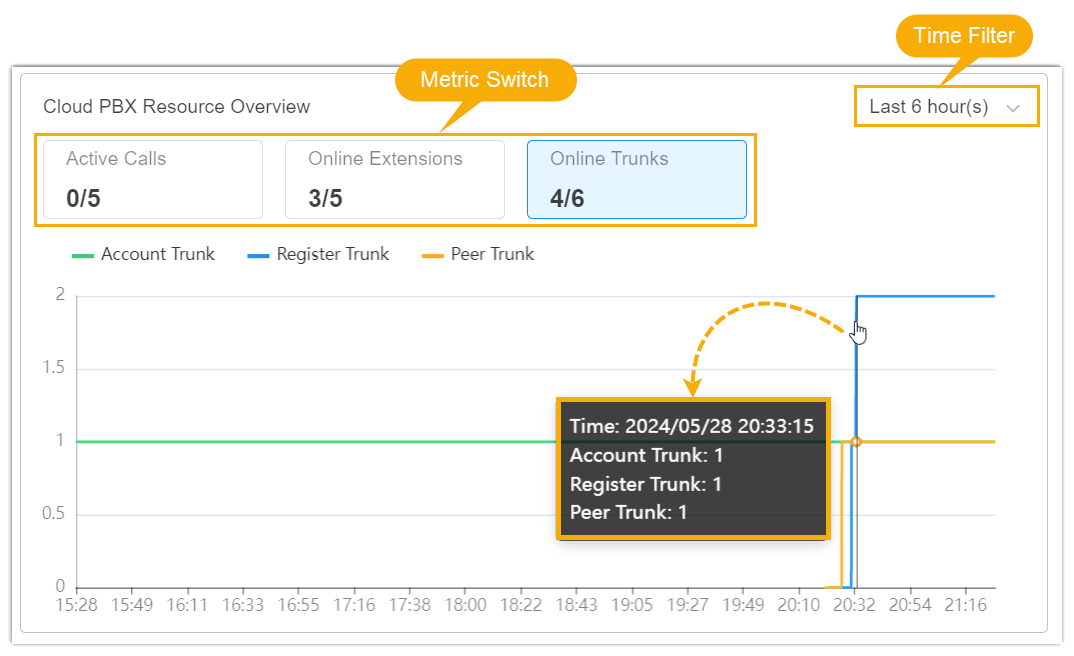
Check resource current utilization
In the field, check the current utilization of active calls (concurrent calls), extensions, and trunks on the Cloud PBX in the last 1 hour, 3 hours, 6 hours, 12 hours, or 24 hours.
| Metric | Description |
|---|---|
| Active Calls | Show the ratio of the number of current active calls to the total number of concurrent calls supported, and provide the trends and details at each time point within the selected time frame. |
| Online Extensions | Show the ratio of the number of extensions currently
registered to the total number of extensions created, and
provide the trend as well as details at each time point within
the selected time frame. Sub-metrics:
|
| Online Trunks | Show the ratio of the number of connected trunks to the total
number of trunks created, and provide the trends and details at
each time point within the selected time
frame. Sub-metrics:
|
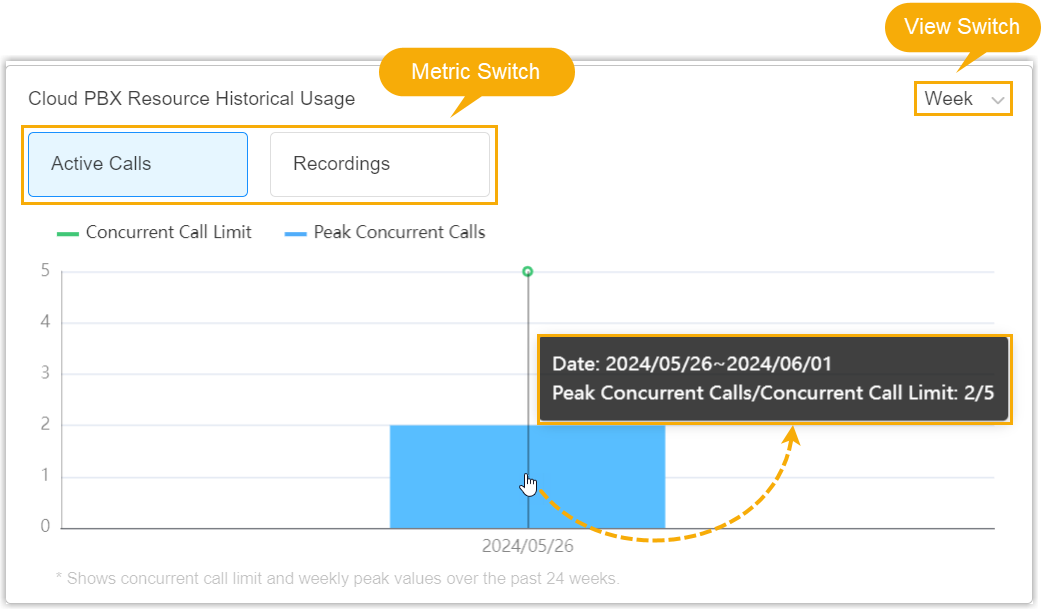
Check resource historical utilization
In the field, check the historical utilization of active calls (concurrent calls), recording minutes, and peak registration number for each terminal type on the Cloud PBX over the last 24 weeks or the last 12 months.
| Metric | Description |
|---|---|
| Active Calls | Show the concurrent call limit and the peak concurrent calls per
month or per week. Sub-metrics:
|
| Recordings | Sum up the number of used recording minutes per month or per week. |
| Terminal Registration | Show the peak registration number for each terminal type per
month or per week. Note: These metrics
represent the peak number of endpoint registrations, not
extensions. Multiple endpoints associated with the same
extension are counted
individually. Sub-metrics:
|