View Call Metrics on Wallboard
As a manager of a queue or multiple queues, you can view the queue call statistics to measure the queue performance. This topic describes how to view queue call statistics.
Prerequisites
- You are a queue manager.
- You have the permission to access Linkus Web Client, and get username and password from your system administrator.
Step 1. Access Wallboard from Linkus Web Client
- Log in to Linkus Web Client.Tip: If you have received a Linkus welcome email, you can click the login link for Linkus Web Client to quickly log in.
- Launch your web browser, enter the IP address of Linkus Web Client, press Enter.
- Enter your username and password, click LOG
IN.
- Username: Extension number or email address.
- Password: Extension User Password.
- Go to .
Step 2. Filter queue call statistics
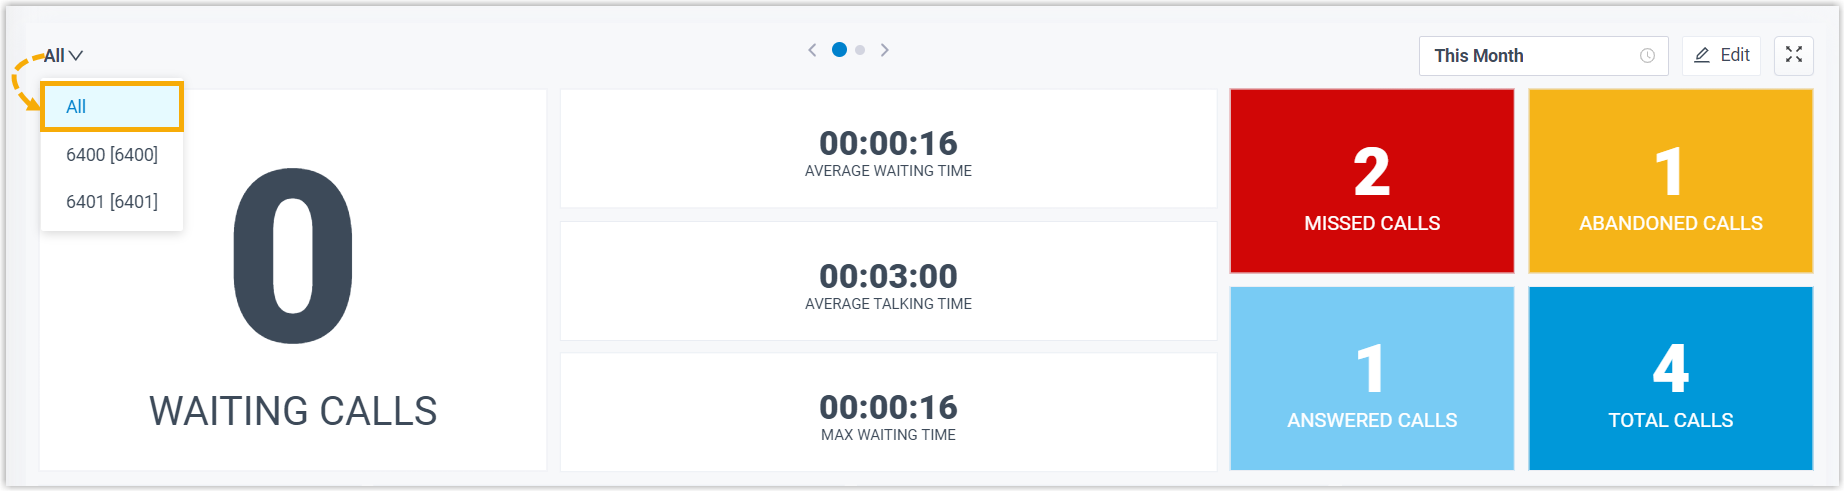
- View call statistics for all queues
-
- At the top-left corner of Wallboard, select
All.
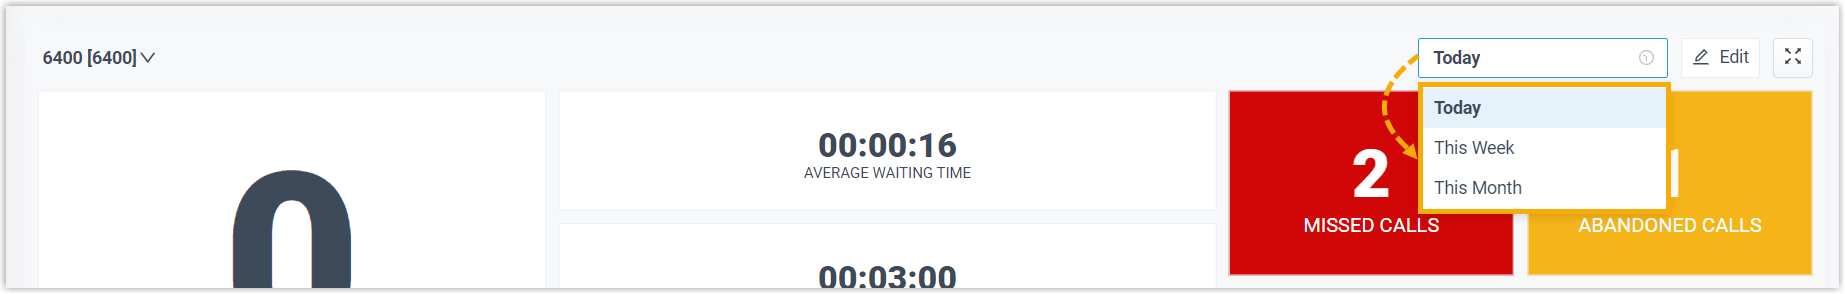
- At the top-right corner of Wallboard, select a time
range.
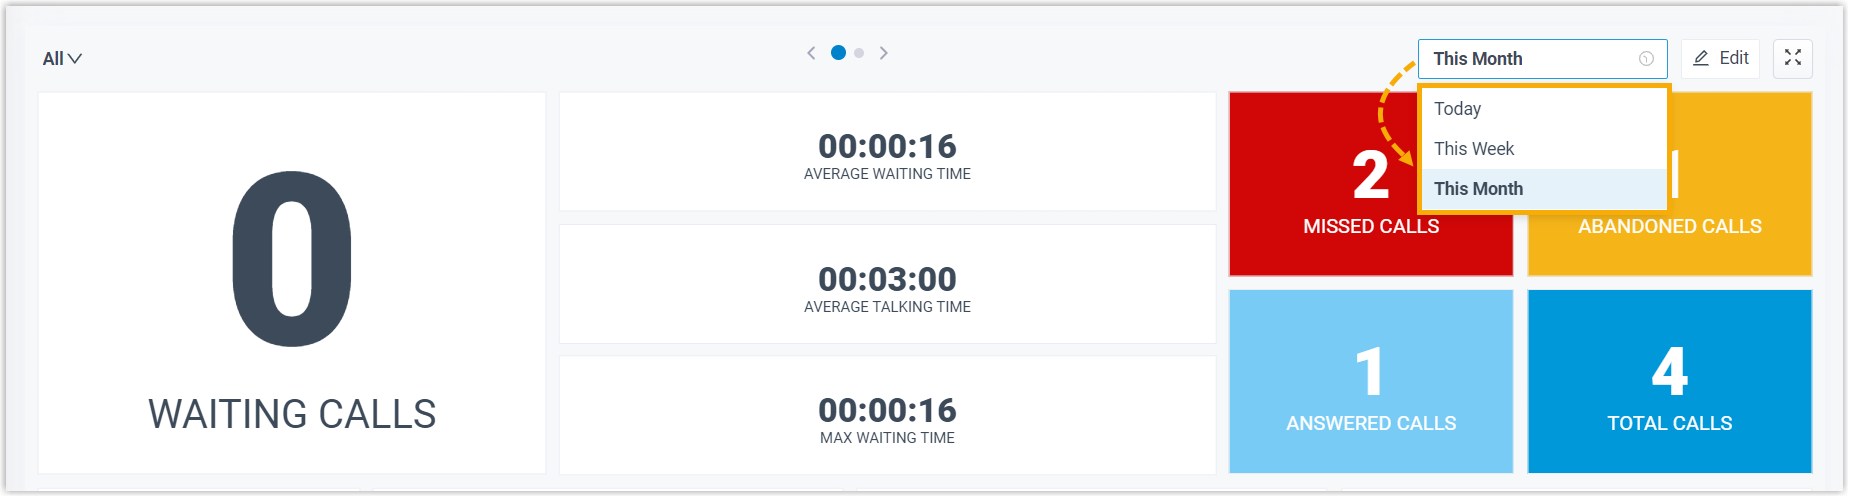
- Today: View statistics of today.
- This Week: View statistics of this week.
- This Month: View statistics of this month.
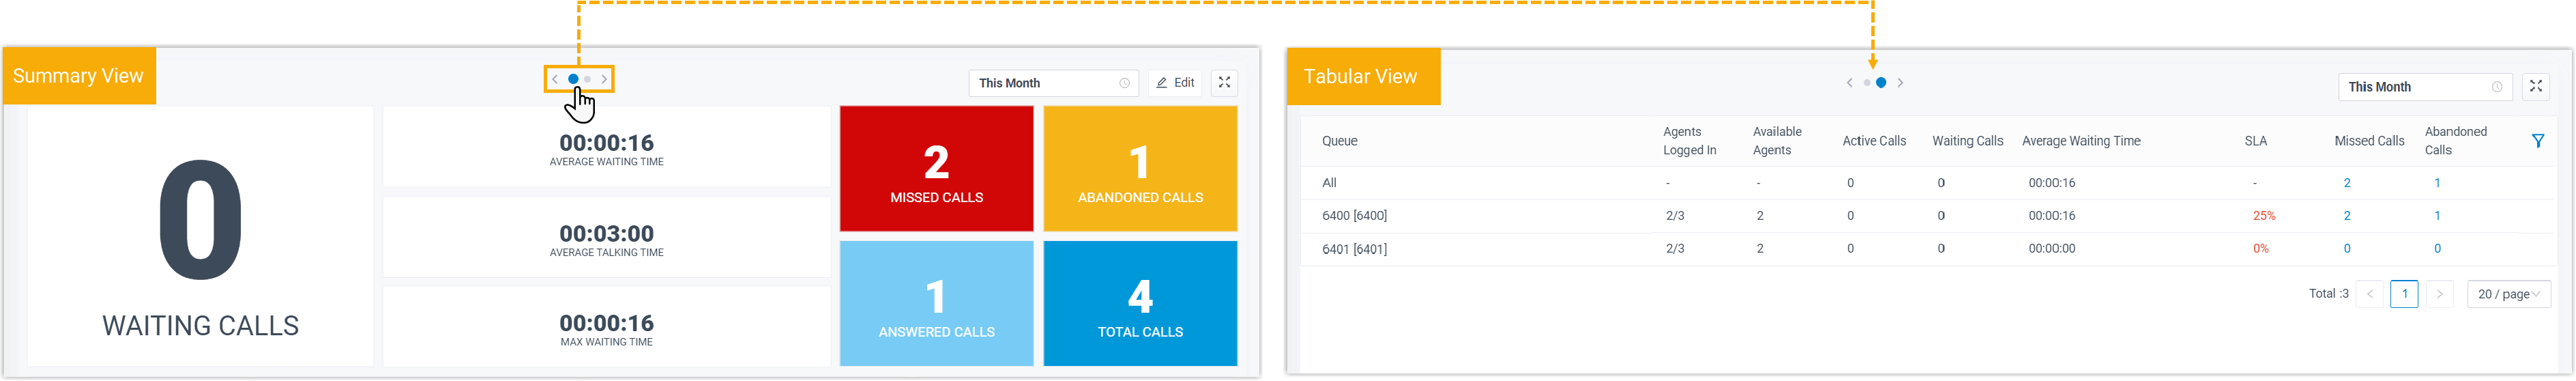
The call statistics for all queues within the specified time range are displayed.
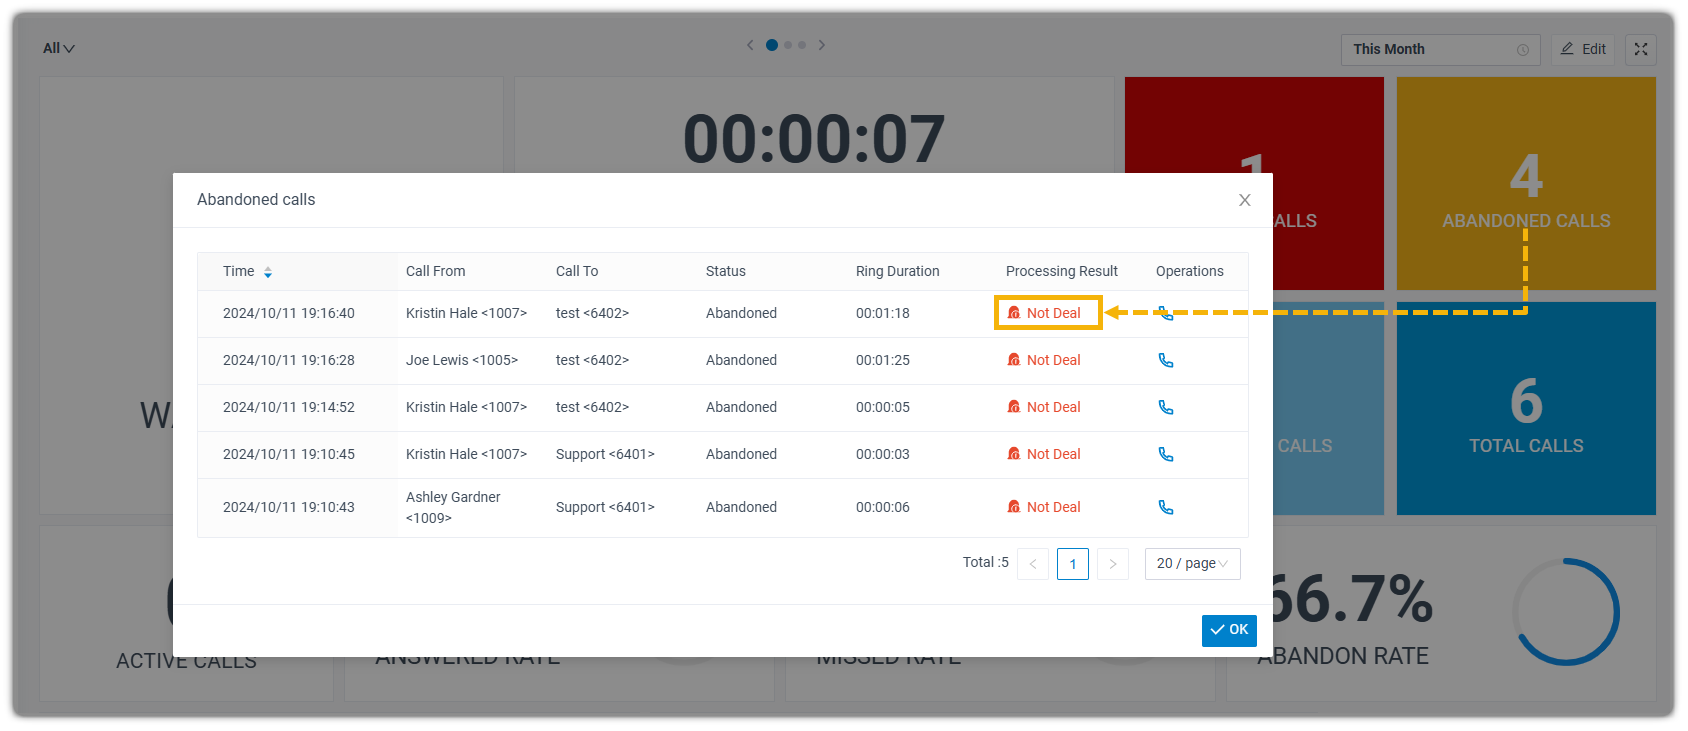
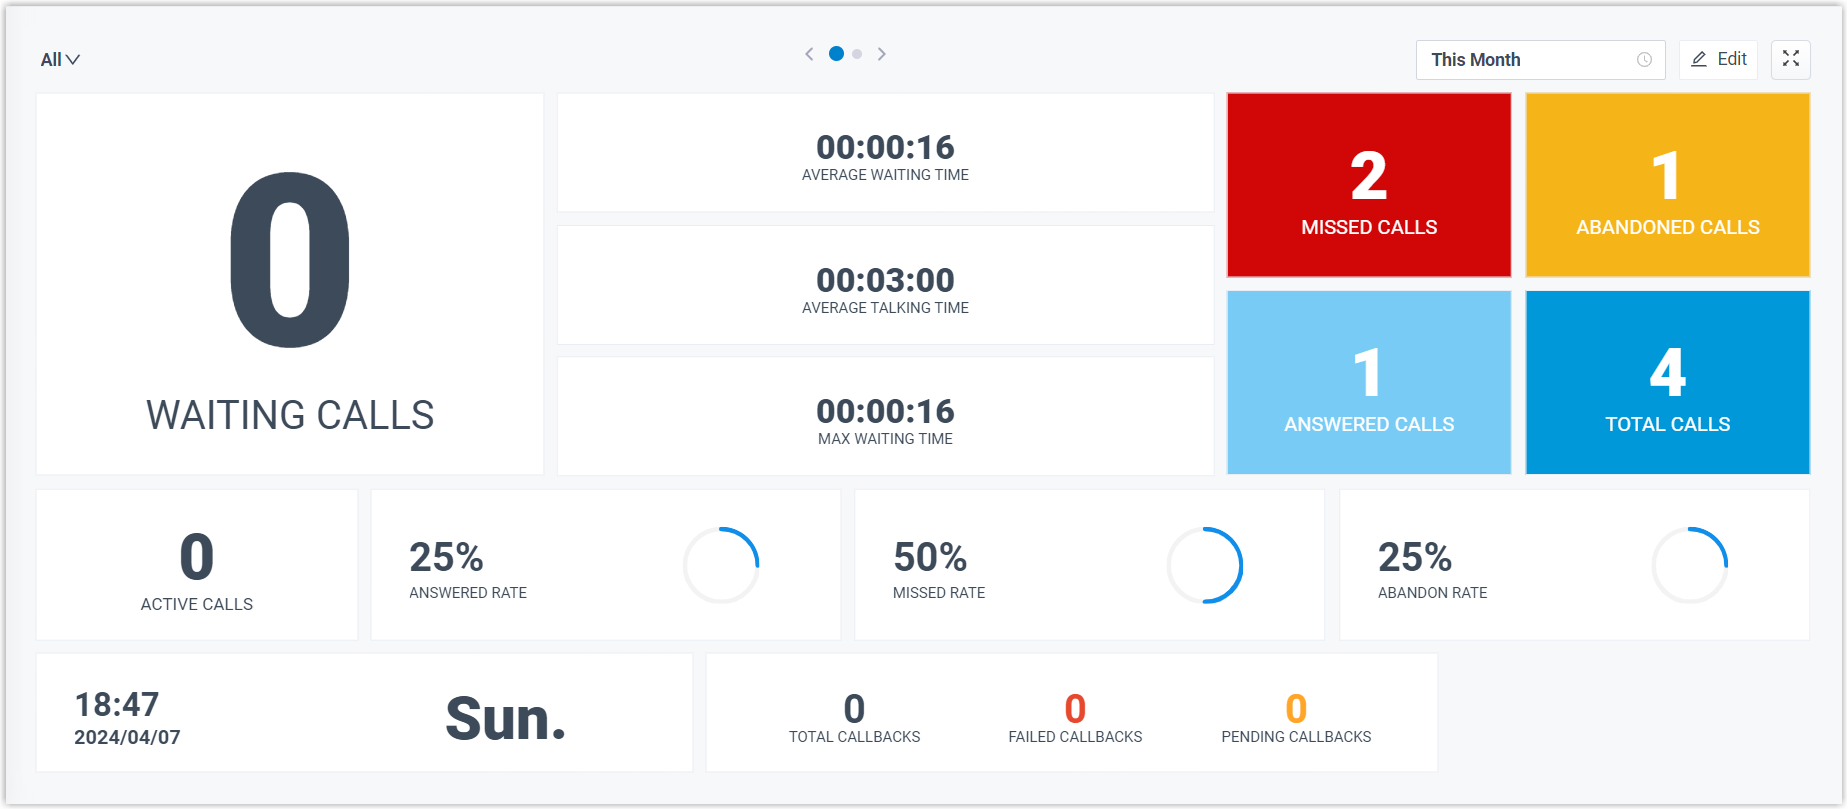 Tip: For MISSED CALLS and ABANDONED CALLS, you can click on the widgets to view the related queue call logs and manage processing status of these call logs. Any other agents who are authorized to view the queue's call logs can see the changes you make on their Linkus clients.
For more information, see Manage Queue Call Logs.
- Optional: On the top of Wallboard, click the toggle
button to switch to the tabular view that displays the detailed
information about call metrics for each call queue.
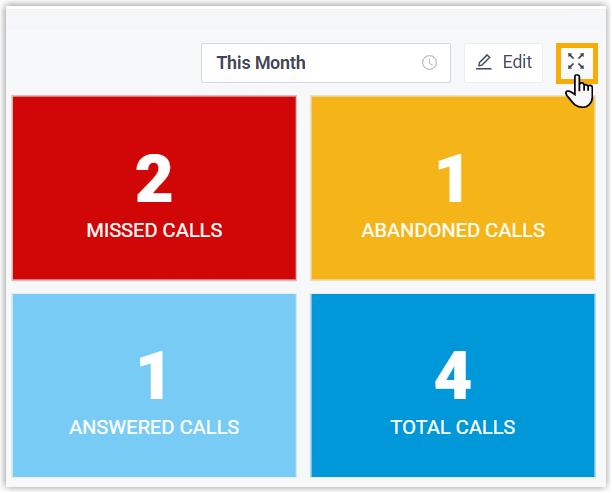
- Optional: Set the Wallboard to display independently in a
separate browser window.
- At the top-right corner of Wallboard, click
 .
. s
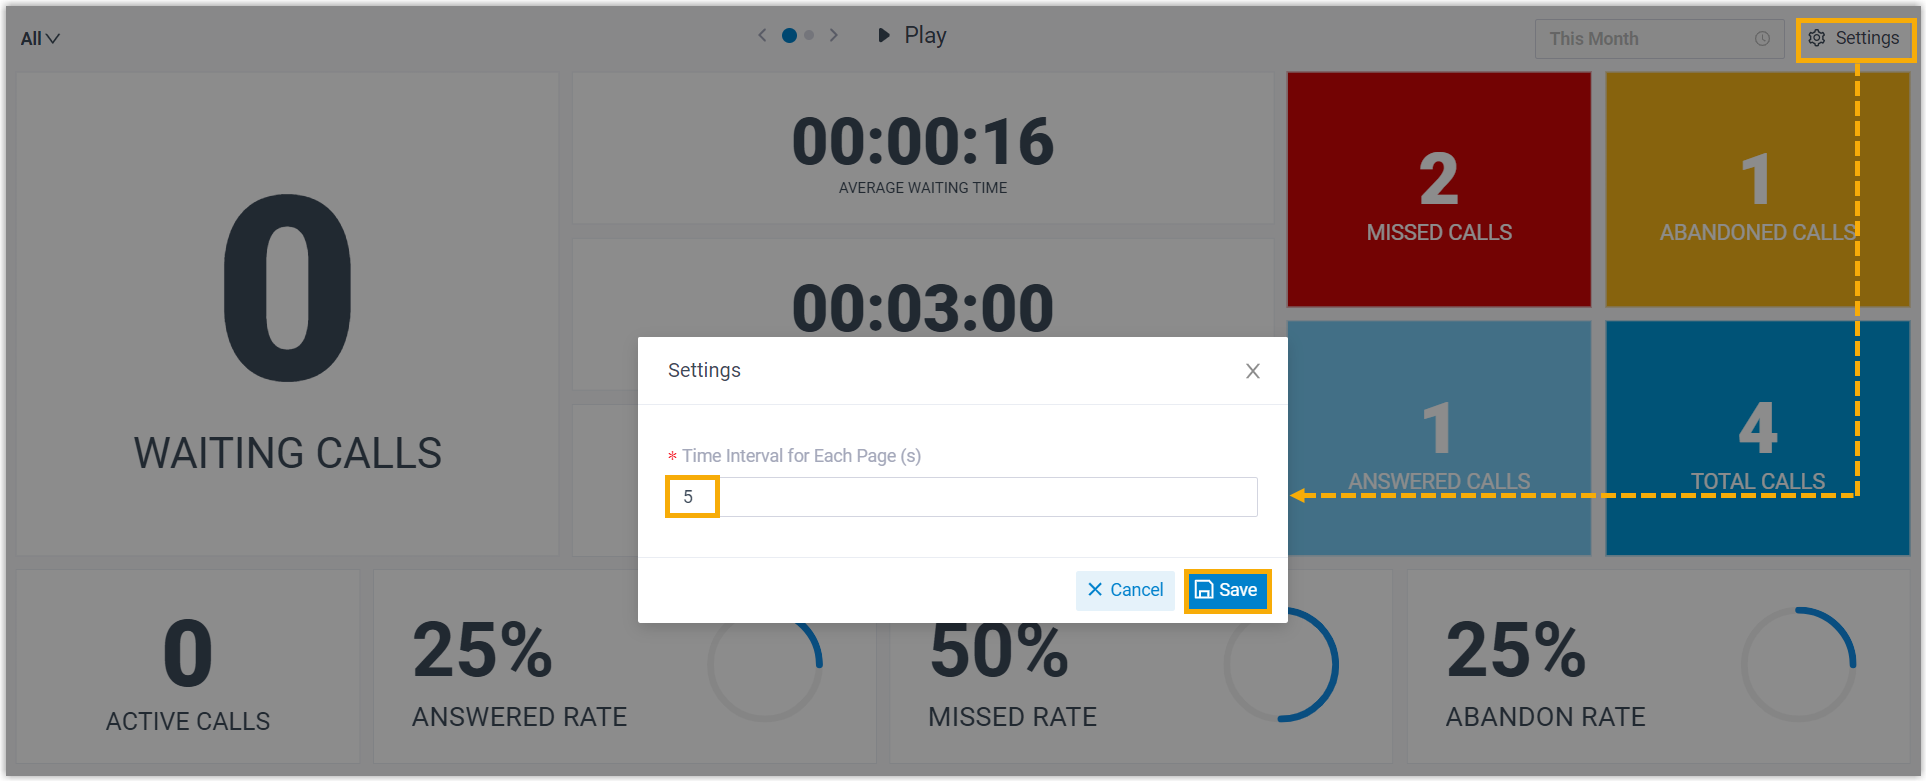
s - Optional: Set the Wallboard to automatically
toggle between summary view and tabular view with a
scrolling display.
- At the top-right corner of Wallboard, click
Settings to set the time to
toggle, then save the setting.
- On the top of Wallboard, click
Play.
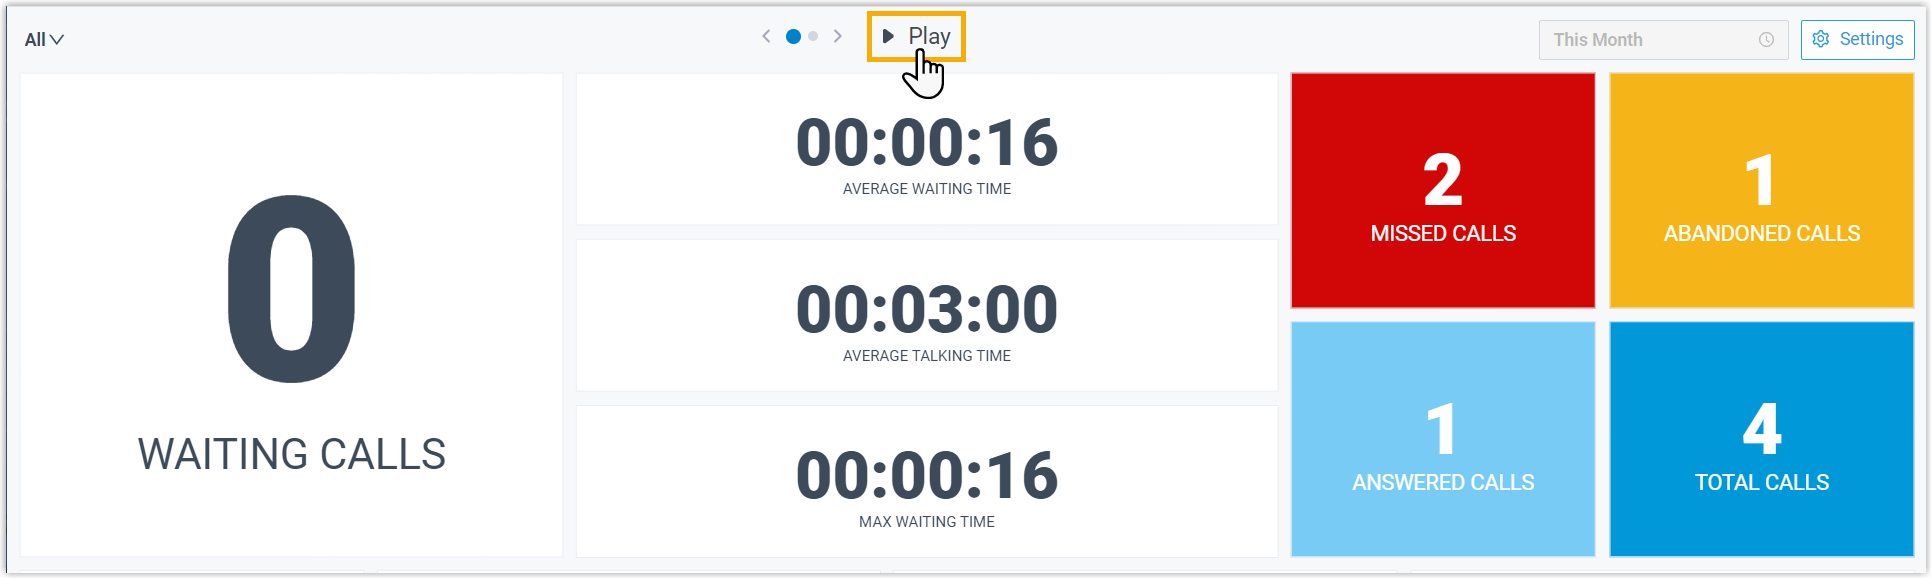
The Wallboard automatically toggles between summary view and tabular view with a scrolling display at the specified time interval.
- At the top-right corner of Wallboard, click
Settings to set the time to
toggle, then save the setting.
- At the top-right corner of Wallboard, click
- At the top-left corner of Wallboard, select
All.
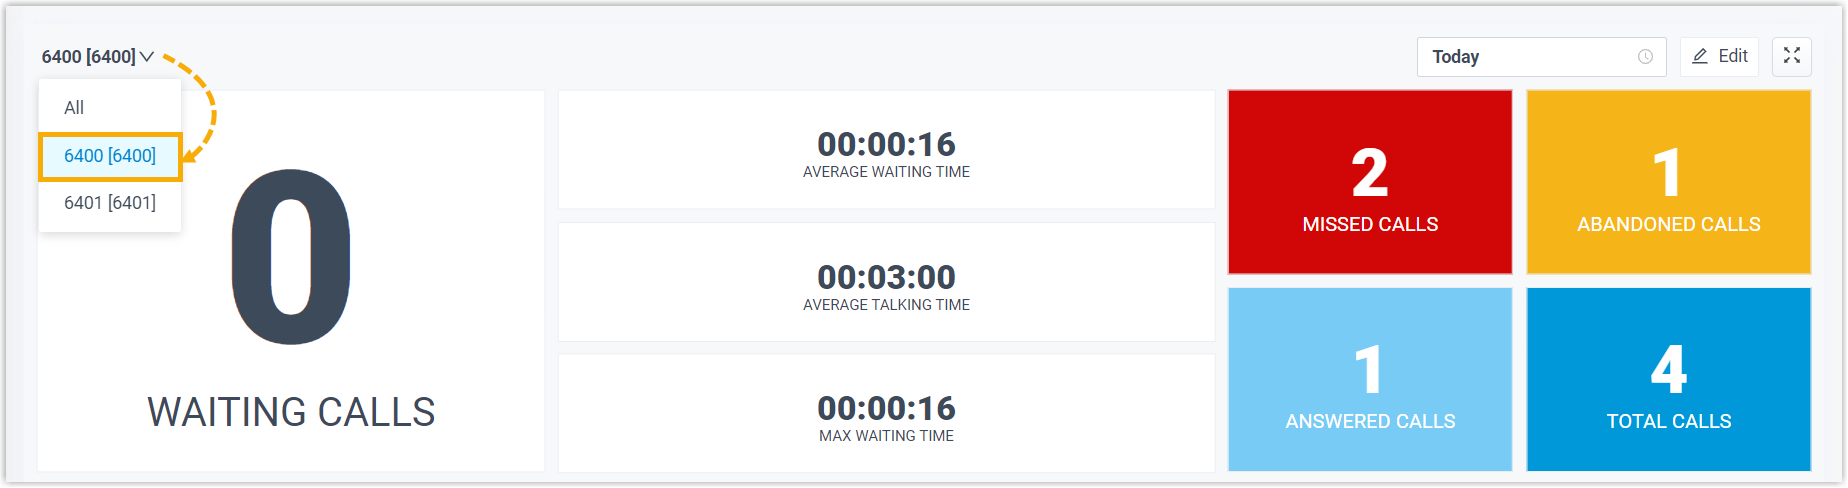
- View call statistics for a single queue
-
- At the top-left corner of Wallboard, select a desired queue from
the drop-down list.
- At the top-right corner of Wallboard, select a time
range.
- Today: View statistics of today.
- This Week: View statistics of this week.
- This Month: View statistics of this month.
The call statistics for the selected queue within the specified time range are displayed.
- Optional: Click to display the Wallboard
of each queue independently in a separate browser window.
For example, display the Wallboard of Service department in a browser window, and show the wallboard to Service agents; display the Wallboard of Sales department in another browser window, and shows the wallboard to Sales agents.
- At the top-left corner of Wallboard, select a desired queue from
the drop-down list.