Dashboard Overview
Yeastar P-Series PBX System Dashboard gives you a historical and real-time view of what is happening on the PBX. This topic describes all the widgets on the Dashboard.
Yeastar P-Series PBX System Dashboard provides widgets to help you monitor system performance in real time, and allows you to quickly access specific PBX features by simple click on headings.
- System performance
- System information
- Plan
- Add-On
- Interface Status
- System status
- Event trend
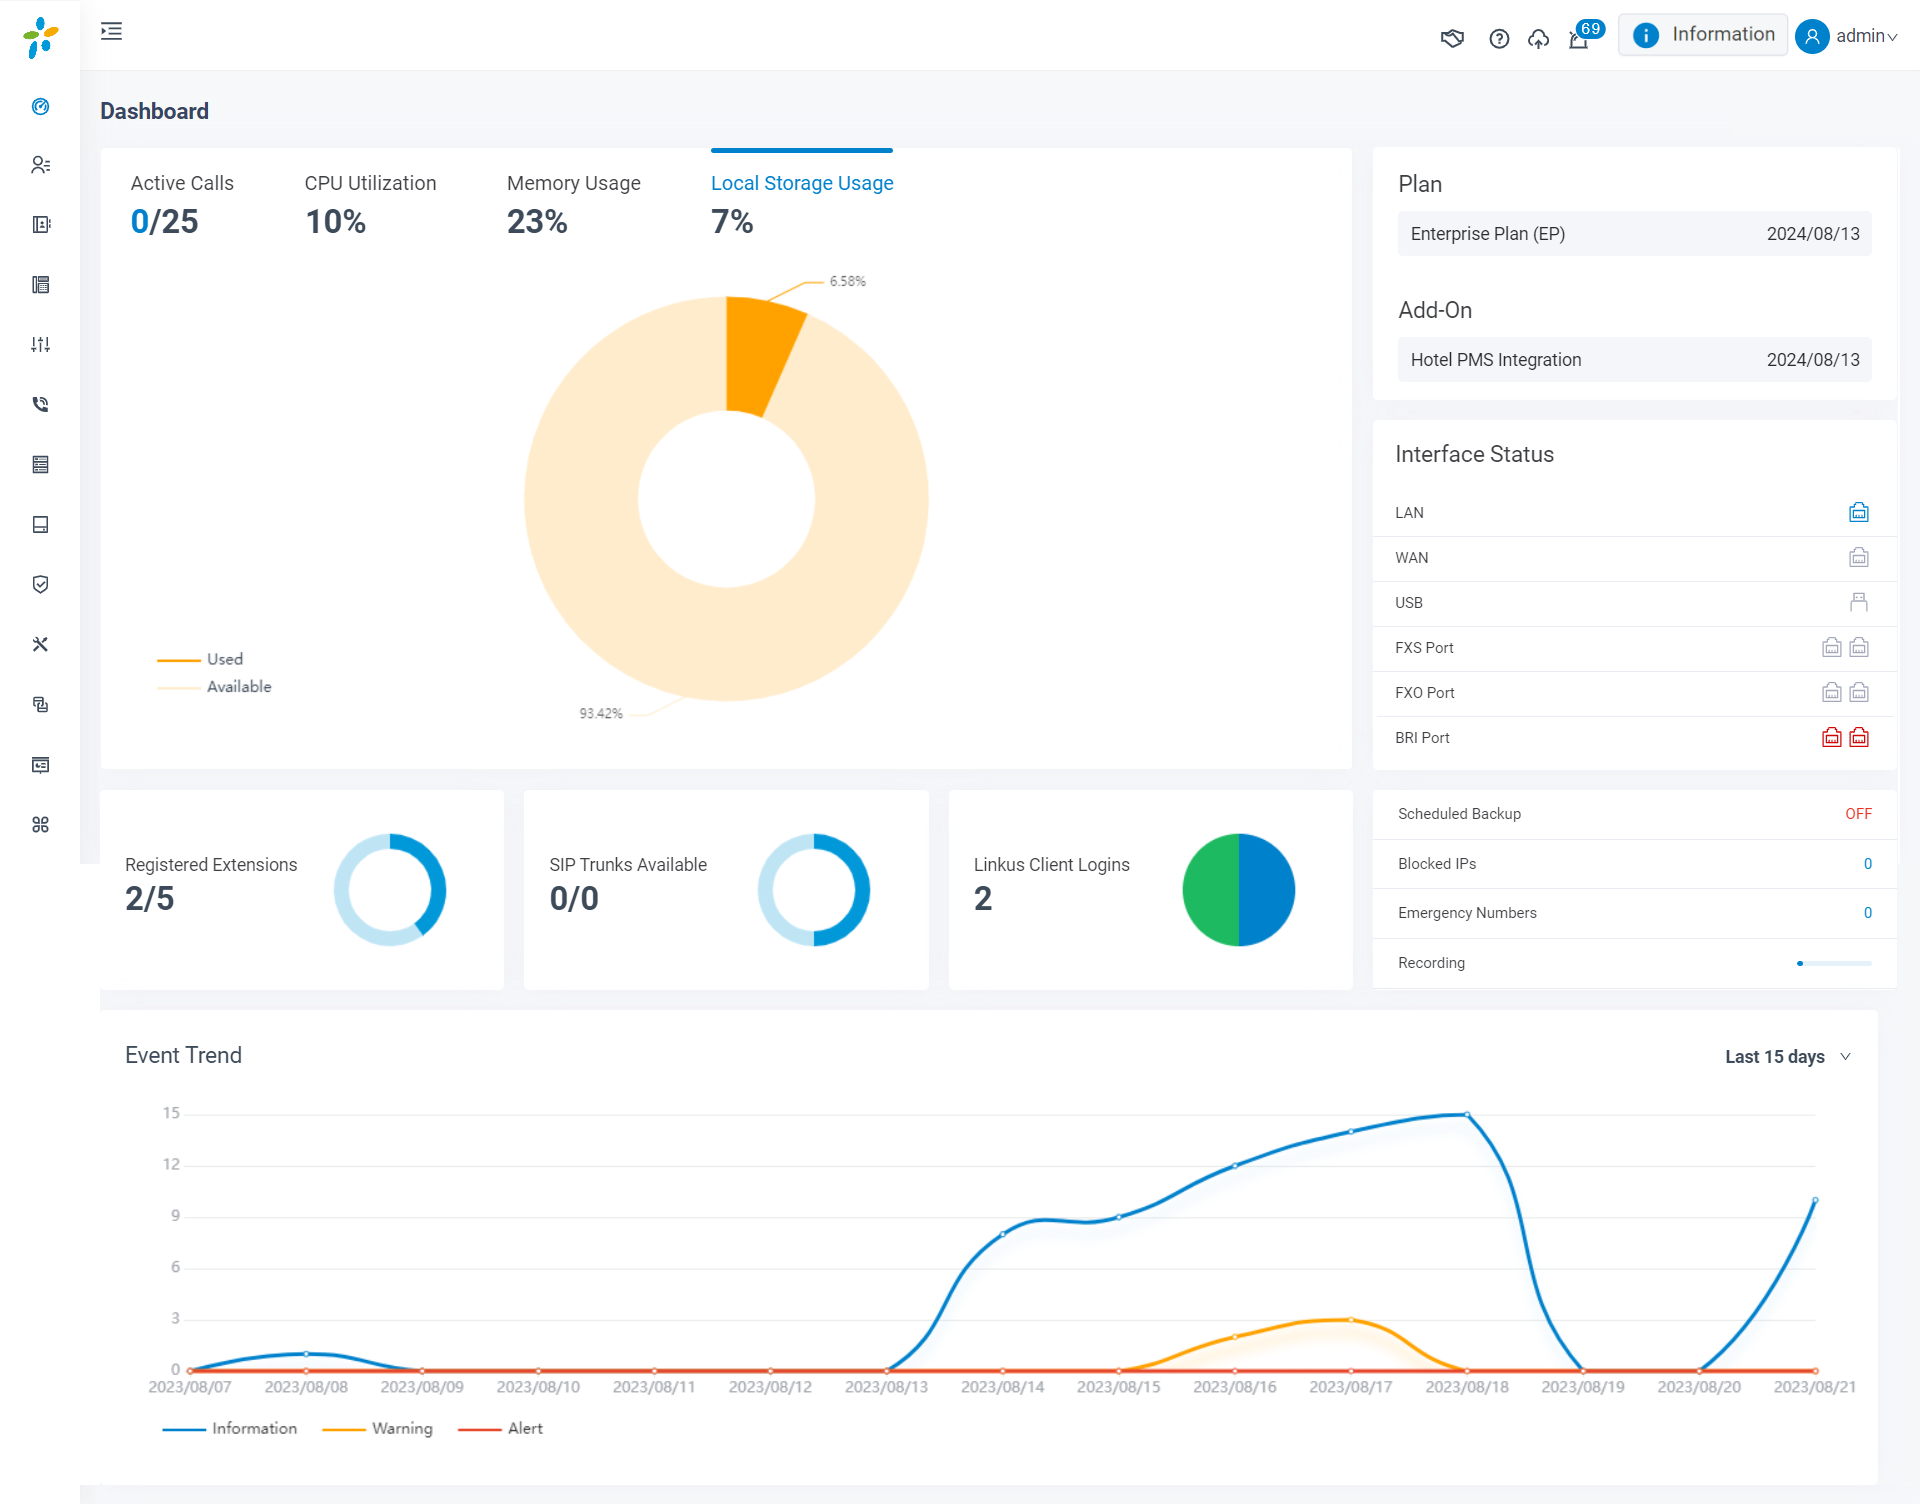
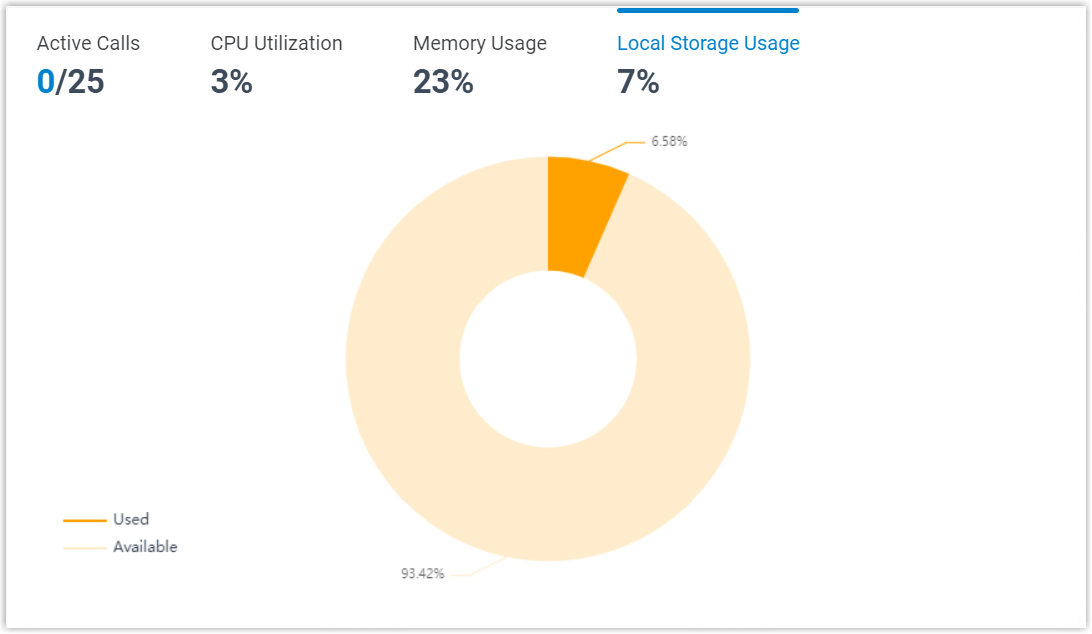
System performance
- Active Calls: The real-time and the supported concurrent calls.
- CPU Utilization: The PBX's CPU usage.
- Memory Usage: The PBX's memory usage.
- Local Storage Usage: The PBX's local storage usage.
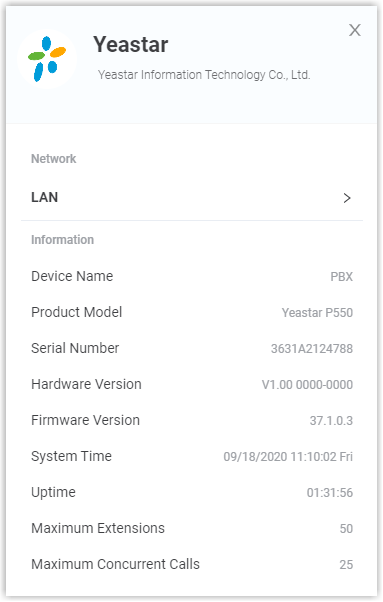
System information
Click Information at the top-right corner. System information displays the PBX's network information and basic information.
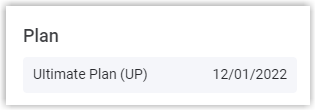
Plan
Plan displays the plan that you subscribe to or try and its expiration date.
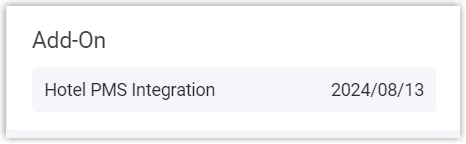
Add-On
Add-On displays the additional service that you subscribe to or try and its expiration date.
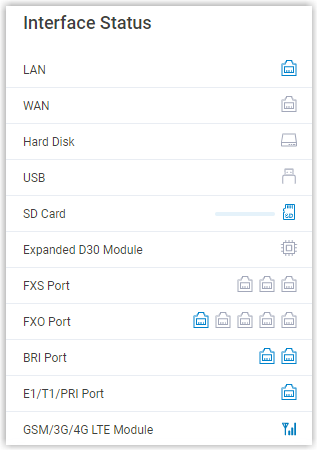
Interface status
Interface status displays connection status of interfaces on Yeastar P-Series PBX System.
| Interface | Description |
|---|---|
| LAN |
|
| WAN |
|
| Hard Disk |
|
| USB |
|
| SD Card |
Note: SD card is ONLY supported on P560 and P570.
|
| Expanded D30 Module |
|
| FXS port |
|
| FXO port |
|
| BRI port |
|
| E1/T1/PRI port |
|
| GSM/3G/4G LTE module |
|
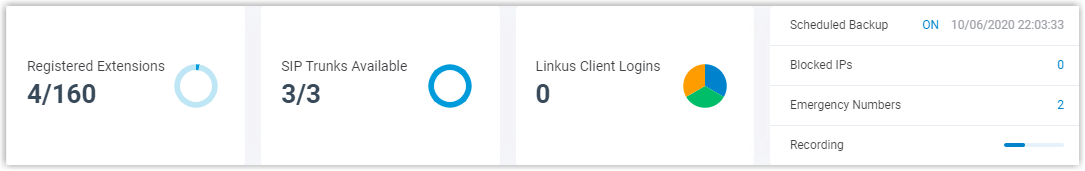
System status
System status displays the following information:
- Registered Extensions: The number of registered extensions and created extensions.
- SIP Trunks Available: The number of available trunks and created trunks.
- Linkus Client Logins: The number of Linkus clients where users has logged.
- Scheduled Backup: Whether scheduled backup feature is enabled or not. If enabled, the system displays the last time when a backup file was created.
- Blocked IPs: Display the following information:
- The number of IP address and account that were blocked by the PBX.
- The last time when an IP address or an account was blocked by the PBX.
- Emergency Numbers: The number of created emergency numbers.
- Recording: How much storage space for recording has
been used.Note: If it displays "Undefined Storage Location", it means that you haven't specified a storage location for recording files.
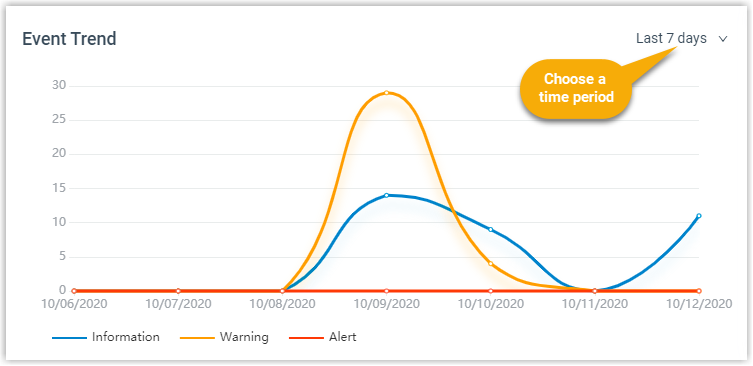
Event trend
Event trend provides historical and real-time view of system events. You can track frequency of events that were triggered during the last 7 days, 15 days, or 30 days.